Tag Archives: Central to Eveleigh

  • -
Screen Shot 2022-08-20 at 1.18.22 pm

2022 – Redfern North Eveleigh PaintShop Precinct Rezoning proposal – submissions

Tags : 

August 2022

SAY NO to the proposed rezoning of this land that will allow for 28 STORY HIGHRISE SKYCRAPER APPARTMENTS.

Screen Shot 2022-08-20 at 1.18.22 pmSubmissions due this Thursday 25 August for the Redfern North Eveleigh Paint Shop Precinct rezoning proposal. The results of this proposal will obviously have dangerous consequences for the North Eveleigh Site which we have seen go from 12 Storeys 2008, 20 Storeys 2016 and now 28 Storeys 2022.

SUBMISSION LINK HERE. Click on the Submission Tab 2/3rds down the page.

Current Planning Laws currently have building heights maxed at 10 Floors.

Screen Shot 2022-08-20 at 3.30.19 pm


The proposed change to legislation will allow for the 28 Storeys.

Screen Shot 2022-08-20 at 12.59.39 pm

Detailed information can be found here on the Redwatch site.

A Submission template will become avaliable in the next two days.

redfern-north-eveleigh-map-07-2022

Proposed Plan


  • -

North Eveleigh Precinct – Online Survey Submissions – Oct 2020 –

Tags : 

Online survey submissions due Sunday 04 October. 

https://yoursay.transport.nsw.gov.au/redfern-north-eveleigh-renewal

Transport for NSW is taking ideas for its Strategic Vision Framework for future development along the railway lines west of Redfern Railway Station, including Carriageworks, with online survey and workshops Wednesday 30 September 5.30pm, Thursday 1 October 4pm and Thursday 8 October at 5.30pm. Details here bit.ly/3kT21fo


  • -
links

North Eveleigh – Urban Growth NSW applies for ‘ReZoning’ of NE area – Oct 2017

Tags : 

Oct 2017 – Urban Growth applies for Rezoning of the North Eveleigh West land area, proposing a new framework to facilitate an increase in existing building heights and FSR (Floor Space Ratio) to allow for up to 700 Dwellings on the 2.9 hectare land parcel adjacent to Carriageworks.

PLANNING NSW Link HERE

Purpose of study:

Investigate preparation of a new planning framework for the North Eveleigh West site, part of the Redfern – Waterloo Authority Sites State Significant Precinct (SSP), to facilitate an increase in the existing buildings heights and FSRs to allow development of up to 700 dwellings.

NSW Planning website “Study Requirements” can be found Here.

The declaration of this SSP is the mechanism used by Urban Growth NSW to reset the planning controls of the area. The current controls are set within the “State Environmental Planning Policy (State Significant Precincts) 2005” under the RWA Redfern Waterloo Authority which permits:


Allowable Building Heights      – 10 STOREYS

Allowable Floor Space Ratio     – 2:1 

We know from prior UrbanGrowthNSW communications that they are pressing for building heights as large as 20 Storeys with an adjusted FSR of up to 6.1:1 for some of the proposed “Superlots”.

The Study Requirements document list the Key Requirements and studies that UGNSW must address to be able to potentially change the planning restrictions currently in place.

Next Steps:

Once a final proposal that addresses all of the study requirements is lodged with the Department of Planning and Environment, this proposal will be publicly exhibited and the community will be invited to make formal submissions. The Department will consider all public submissions in assessing the proposal.

Stealing Our Skies will keep you updated with developments on this regard.

Past SOS posts of interest:

Urban Growth NSW’s 2016 North Eveleigh Plan exceeding allowable Floor Space Ratio (FSR)

North Eveleigh – March 2016 Plan – High Density Living and Open Space Provision – A Vibrant Community Heart?

Picking Holes in the Urban Growth NSW 2015 Concept Plan

If you wish to be included in future updates from this website send an email to wordpressATstealingourskiesDOTcom


  • -
screen-shot-2016-12-03-at-10-08-59-am

Wilson Street – Proposed Bicycle Lanes – Your Say

Tags : 

Have your say on the City of Sydney Website and view the plans for a new Cycle Way on Wilson Street.

PDF Plans can be found in the lower Right Hand side of the below Weblink.

http://sydneyyoursay.com.au/sydneycycleways

Take Part in the CoS Survey here:

http://sydneyyoursay.com.au/sydneycycleways/survey_tools/wilson-burren-survey

screen-shot-2016-12-03-at-10-08-47-am


screen-shot-2016-12-03-at-11-15-02-am


screen-shot-2016-12-03-at-11-15-35-am


screen-shot-2016-12-03-at-11-16-23-am


  • -
wipeb

New Central to Eveleigh Website – a more realistic North Eveleigh image comparison

Tags : 

The new C2E website has a new page for North Eveleigh. Mid way down the page is a current/proposed image comparison.

Use the slider underneath the image below to see a more realistic lensing of the ‘proposed’ image.

“North Eveleigh with view of the Historic Clothing Store, current and proposed”

Author Note – The buildings in this image are indicative of height, scale and massing. The look of them however is not representative of what is proposed.

A little more alarming compared to the super wide angle rendering provided…….. which as discussed here cheats the realistic height and massing of the proposal.

wipec


  • -
FloorSpaceRatio Map

North Eveleigh update – 10 Sept 2016

Tags : 

North Eveleigh – application for proposed amendments to current planning policy for increase in Building Heights and increase in allowable Floor Space Ratio.

UGNSW are currently completing a number of the technical studies, including traffic modelling, to finalise the North Eveleigh proposal. UGNSW are also continuing their work to finalise the Urban Transformation Strategy to guide development of government owned land in the Central to Eveleigh area.

UGNSW hope to lodge a State Significant Development Application and proposed amendment to the relevant State Environmental Planning Policy with the Department of Planning and Environment later this year. It is assumed the changes will be to raise Building Height limits and allowed Floor Space Ratio. (FSR limits relate to how much Floor area can be built on a given land area)

Current Legislation allows for a maximum of 10 storeys and a Floor Space Ratio of 2:1. The UGNSW North Eveleigh Plans are aiming for 20 Storeys with a FSR of around 6:1.

More info here

The Department will coordinate the statutory exhibition and confirm its timing. As a minimum the proposal will be exhibited for 30 days.


  • -
North_Eveleigh_-_Wilson_Street

Wilson Street Frontages – 3 Storeys! – 15 June 2016

Tags : 

There is a new image on the C2E website showing Wilson Street frontages.

North_Eveleigh_-_Wilson_Street

Just what we feared – 3 storey buildings facing Wilson Street.

These must be 2 storey on Wilson Street. We have also told Urban Growth the roofs on these appts should have a 45 degree incline away from the street as seen on all the surrounding properties.

From Urban Growth website re scale:

  • tapering taller buildings down towards the edges of the site to reflect the scale of neighbouring buildings
  • incorporating characteristics of local historical buildings into building design
  • varying the height and form of buildings with podiums that reflect heights of existing industrial heritage buildings and to achieve a more human scale at street level.

It would be good for UG to show how these buildings present them selves to the Platform Appts.

Urban Growth will be creating the sites DCP (Development Controls Plans) which the eventual developers will have to comply to. The DCP applies restrictions to subsequent building proposals and as such we need to make sure these types of restrictions are added.


  • -
c2eMeeting

City of Sydney – C2E – Public Meeting – Wed 15 June 2016 – ATP – 6.30pm

Tags : 

The City of Sydney is concerned about current proposals by UrbanGrowth NSW for the redevelopment of the Central to Eveleigh precinct.

A public meeting will be held to discuss the future of the Central to Eveleigh precinct.

The Theatre, Bay 4
Australian Technology Park
2 Locomotive Street, Eveleigh

6.30pm to 8pm

Entry to The Theatre is via Bay 4.

http://www.cityofsydney.nsw.gov.au/council/news-and-updates/featured-articles/central-to-eveleigh-strategy

c2eMeeting2


  • -
30mm Lens

City Of Sydney – Council discussing Central to Eveleigh – May 16 2016

Tags : 

CoS Council meeting Discuss Central to Eveleigh 

There were a few mentions relating to Urban Growths plans for Central to Evening in this months council meeting.

They are outlined in the smh article here:

http://www.smh.com.au/nsw/clover-moore-alarmed-by-waterloo-apartment-plans-that-dwarf-singapore-20160516-gowfr0.html

Below are the council extracts.

Item 4.  Central to Eveleigh Update

From the Chief Executive Officer

http://www.cityofsydney.nsw.gov.au/__data/assets/pdf_file/0003/255882/160516_COUNCIL_ITEM43.pdf


Item 12.  Notices of Motion

From Councilor Scott:

http://www.cityofsydney.nsw.gov.au/__data/assets/pdf_file/0011/255890/160516_COUNCIL_ITEM12.pdf

It is resolved that Council:

  1. (A)  note:
    1. (i)  the significant increase in resident and visitor populations predicted for the Central to Eveleigh precinct; and
    2. (ii)  the continuing uncertainty surrounding UrbanGrowth’s development plans for the area; and
  2. (B)  request the Chief Executive Officer to:
    1. (i)  investigate the possibility of installing City wayfinding information and better lighting between Redfern Station and Carriageworks;
    2. (ii)  seek to work with Carriageworks and the State Government to investigate integrated ticketing for cultural and other events at the Central to Eveleigh precinct and a shared approach to arts and cultural services between the City, Carriageworks and UrbanGrowth; and
    3. (iii)  write to the CEO of UrbanGrowth and Transport for NSW expressing Council’s strong support for:

(a) better pedestrian links through the Central to Eveleigh site, in particular, a pedestrian link from Redfern Station to Carriageworks and a bridge from ATP to Carriageworks; and

(b) working collaboratively on a plan for affordable housing dwellings in the North Eveleigh precinct.


  • -
CoS_April2016

City of Sydney responds to North Eveleigh April 2016 Plans

Tags : 

City of Sydney response to Urban Growth on 2016 North Eveleigh Plans

April 27 2016

PDF available Here

Quick Overview

The City and UrbanGrowth have agreed to a Memorandum of Understanding promoting agreed objectives and principles on major urban transformation projects. Despite the Memorandum, the dwelling targets and building heights at North Eveleigh have been developed independently by UrbanGrowth.

  • Affordable Housing – The Plans should commit to 12% of all housing, consistent with the 2008 plan approval.
  • Parks and Community Spaces – Urban Growth should clearly identify the area measured as part of the park, to allow an understanding of how the park has increased. The shape of the park could be further improved.
  • Connections – The pedestrian connection at Golden Grove should be re-instated. A clear strategy for the Corridoor Crossing should be identified if Urban Growth wish to implement this Key move from the Central to Eveleigh Vision.
  • Buildings – New Development should avoid overshadowing to the neighbouring properties. The development should be wind tunnel tested.


  • -
22mm 3D wilson Street

Wilson Street Apartment Plans ? – (April 2016)

Tags : 

To date we have not seen any renderings/artist impressions of the Wilson Street apartments in the North Eveleigh Plan.

What we Do Know

  • They are referred to as 3-4 storey Apartments.
  • They are currently slated to be built last, after the two superlots at the rear of the site. We should get them to be built at the same time to lower the time of construction which is currently estimated to finish in December 2020.
  • The latest cross section has almost 3 Storeys of the 4 storeys at Wilson Street level.  We were told in the April info sessions that it was TWO levels at Wilson St street level.
2016_CrossSection

2016 Plan – Elevation

  • The lower level is proposed for Retail. This is probably necessary as the solar access will be Null on the lower level.
  • We have asked for the roofs to be sloped to match in with the rest of the surrounding area.
  • They are to have two levels of underground Parking. (2008 approved plan)
  • Each of the two blocks will house approximately 60 residents each
EstimatedResidents

2015 Urban growth info board

  • There is a setback of what appears to be at least 1 meter from the current fence line
  • There is a 6 meter difference in height between the CarriageWorks Way level and Wilson Street.
2008_site Elevation

6 meter elevation difference bw Wilson Street and CarriageWorks Way – 2008 Site Elevation

  • The area for these apartments is quite small. The width of the blocks are only 10 meters (including passageways)
BuildingWidth-Wilson

Wilson Street Building Width 

What we Don’t Know

  • Where will the entrances be?
  • How will the underground Car Parking work off Carriageworks Way and how it will effect traffic on the two way thoroughfare?
  • How will the apartment blocks present to Wilson St?
  • How will the apartments blocks present to the existing Platform Apartments residents?
  • Will there be fences on Wilson Street?
  • Where will these residences sit within the price range of available Stock? Will they be some of the new “Reduced Cost Housing” stock?
  • Will they have balconies facing existing residents on Wilson Street?

We must push Urban Growth NSW for detailed information.

Saving Our Skies


  • 2
sightlines

Urban Growth now using Trees to measure building sightlines?

Tags : 

The 2008 Concept Plan Approval fixed the heights of buildings such that they were below a line of sight from the northern side of Wilson Street (Figure 1).

compareView

As seen above in the Nov 2016 plans Urban Growth sneakily tried to get around this by having the ‘bystanders’ sight line from the south side of Wilson Street. City of Sydney quickly picked up on this and ordered it to be addressed.

Now Urban Growth, in what may be a World First, is now using trees in their measurement of sightlines in their April 2016 Plans!  The Website Link Here – Minimising the Impacts of new buildings.

sightlines

Using imagery (like below left) to show the lovely mature trees covering the view of the 20 Storey buildings they failed to show the same view a few meters down Wilson Street where the trees definitely do not coverup the sightlines.


  • 1
3D_NE

In Response to Urban Growth Artists Impressions of the 20 storey buildings (April 2016)

Tags : 

The Old Trick of using Wide-Angle lenses to distort space, distance and size. 

The new images on the Urban Growth website (April 2016) show some very nice pictures outlining how unobtrusive the new 20 storey buildings could be.

Unfortunately they don’t represent reality as the stills are taken with very Wide Angle Lenses (estimated 18mm) .  Human vision rests somewhere between 35mm and 70mm, depending on the size of the sensor/film aperture.

Wide angle lenses, commonly used in real estate brochures to make rooms look more spacious than they are, distort imagery in the following ways:

  • They make objects further away appear a lot smaller
  • They have a wider horizontal field of view
  • This wider view can approximate our total peripheral vision but in doing so makes objects appear a lot smaller than in reality.
  • Open your phone camera and point it in front of you. If its a newish phone it will have a lens around 26mm. Even this lens is quite wide and whilst built to take panoramic happy snaps you can easily see the difference between it and your own human vision.

3D Scale Model of North Eveleigh

So below we take the same pictures, in very similar places, instead with lenses which more approximate the human vision field of view. With Google Maps, containing site elevations, as our Floor Plan we made a 3D model of the proposed North Eveleigh development and positioned the camera in similar places.

3D_NE

3D buildings recreated over Google Maps.

Comparison of Lenses

A good way of telling if an image has been taken with a wide angle lens is looking at how distorted the edges are. We start with the golden grove example.

Golden Grove

Looking at the Original website example for Golden Grove you can see how distorted the edges are. Replicating this in our 3D program with a few trees and similar 2 storey buildings and terraces we get the same ‘pinched’ effect with our 19mm lens.

Now a 3D render from the same spot, just in front of the Abercrombie/GoldenGrove roundabout, with a 50 mm Lens. Not so unobtrusive….

50mm lens

Golden Grove 50mm lens

CarriageWorks Way Entrance

This one is a little trickier as the artist has had to realign the 3d buildings so they appear straight with a process called UnLensDistort.

Now a 3D render from the same spot with a 26 mm Lens. Not so unobtrusive….


Enterance_3d_26mm

CarriageWorks Way 26mm lens


Wilson Street

This one was used as an example to show how the existing trees in the area hide the bad sightlines. More on that in another post.

I have moved our camera opposite the last terrace on Wilson adjacent to the public housing site just sold.

In the below render I have included the proposed 4 storey building along Wilson Street. (We really have to see plans for these apartments and whether they will be 2 storeys at Wilson Street and how they will react with the surrounding street scape. I have made them 3 storeys at wilson St which is good for the sight line but they are supposed to be two, Pity they added an extra level to the platform apartments)

22mm 3D wilson Street

22mm 3D wilson Street

 Clothing Store

This one is great, another unrealistic camera.


And the following render taken from the Iverys lane end of the park with a 44mm lens.


ClothingStore_44mm

Clothing Store 3D 44mm Lens

Urban Growth Artist Impressions (April 2016)

North_Eveleigh_West__-_Golden_Grove_Street_Rev_C

Urban Growth Artist Impression Golden Grove

North_Eveleigh_West__-_Leamington_Ave_-_Rev_C

Urban Growth Artist Impression Leamington Ave

North_Eveleigh_West__-_Podiums_Rev_C

Urban Growth Artist Impression View1

North_Eveleigh_West__-_Wilson_Street_Rev_C

Urban Growth Artist Impression Wilson Street


  • -
comparisons

North Eveleigh – March 2016 Plan – High Density Living and Open Space Provision – A Vibrant Community Heart?

Tags : 

High Density and Open Space Provision in North Eveleigh 2016 ?

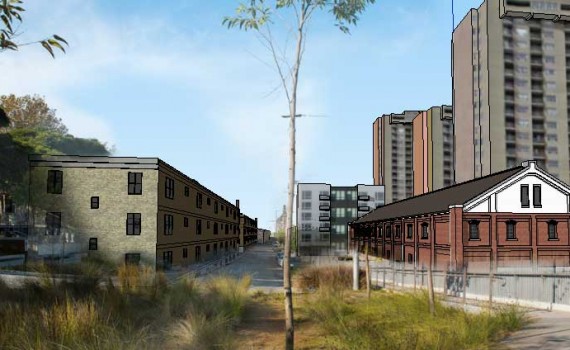
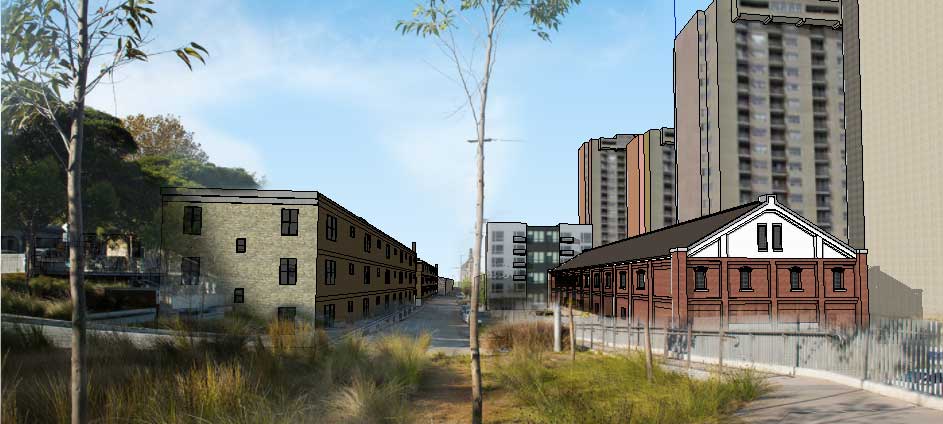
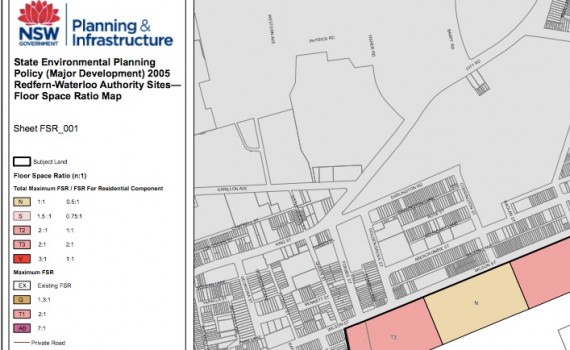
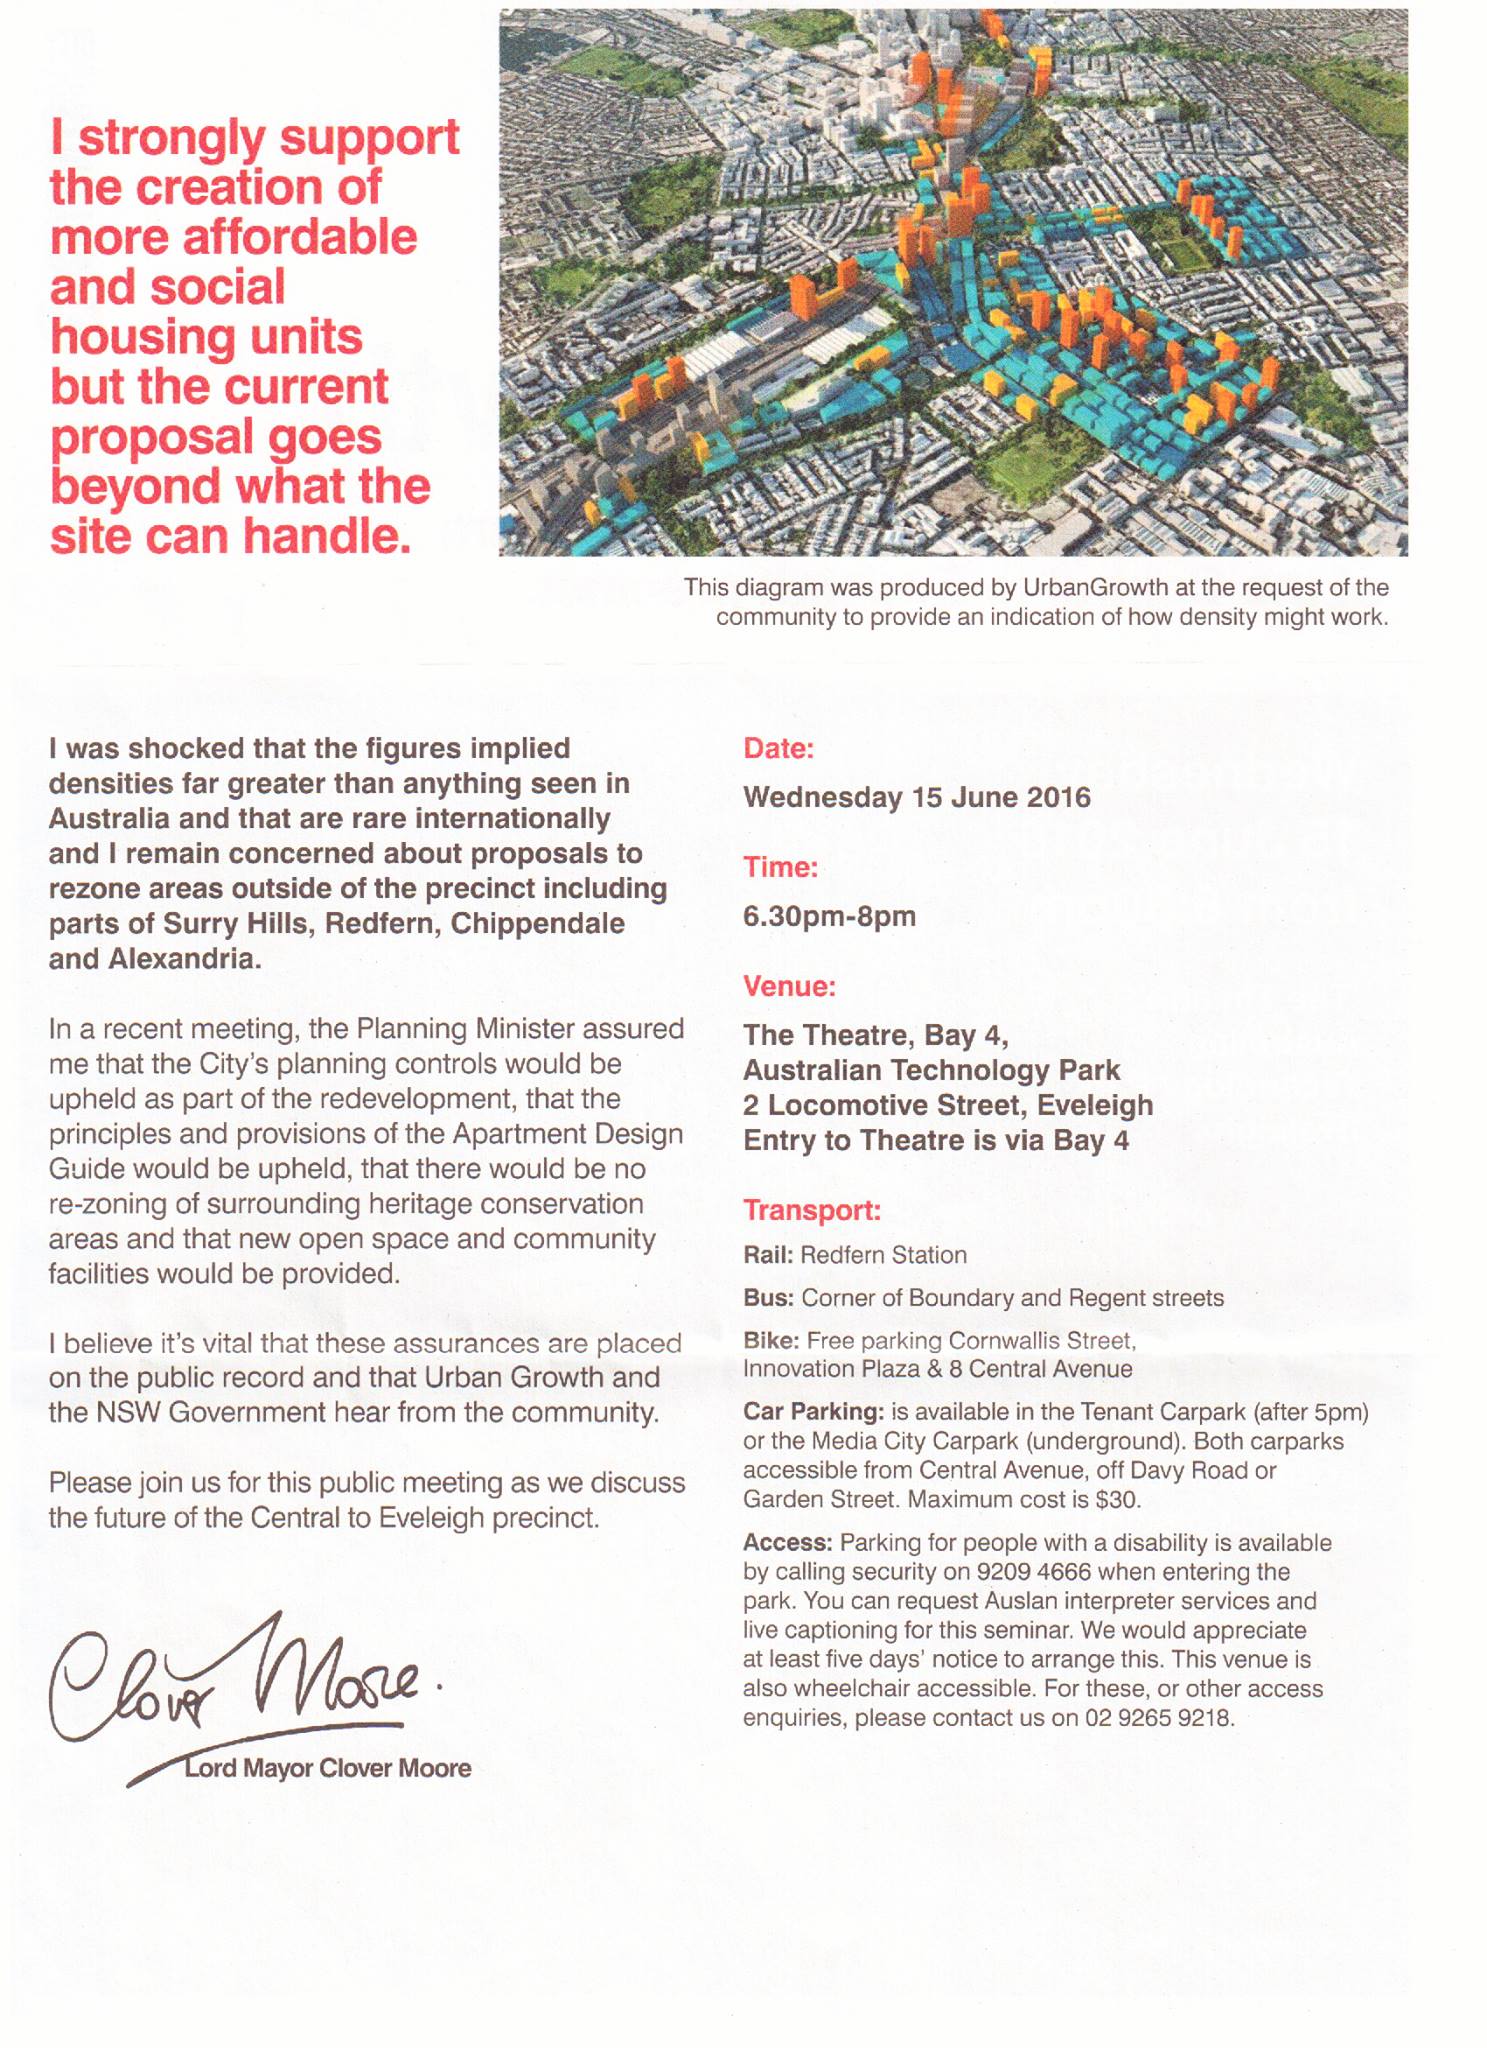
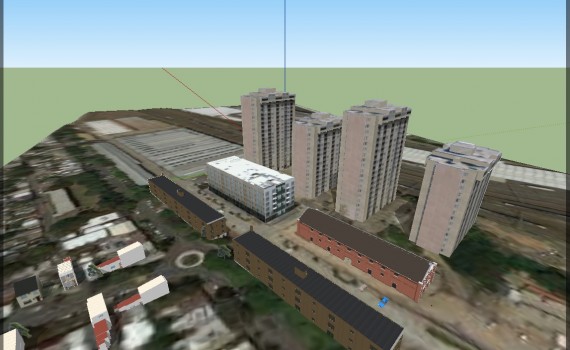
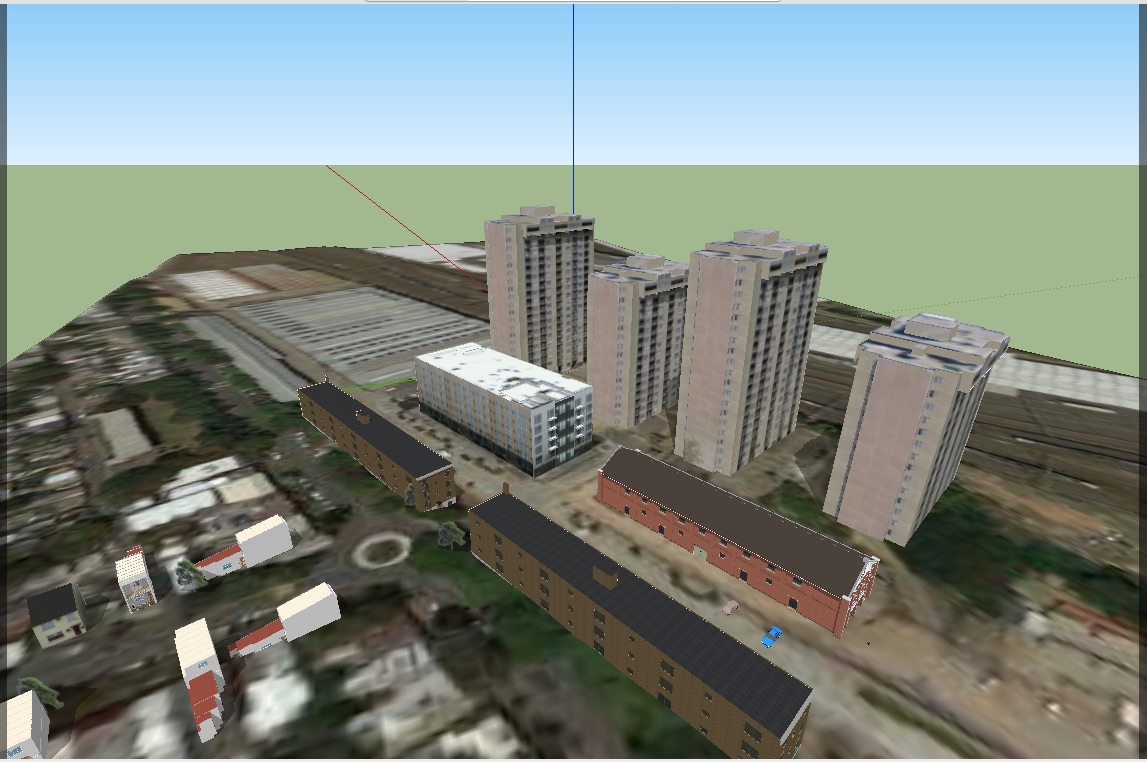
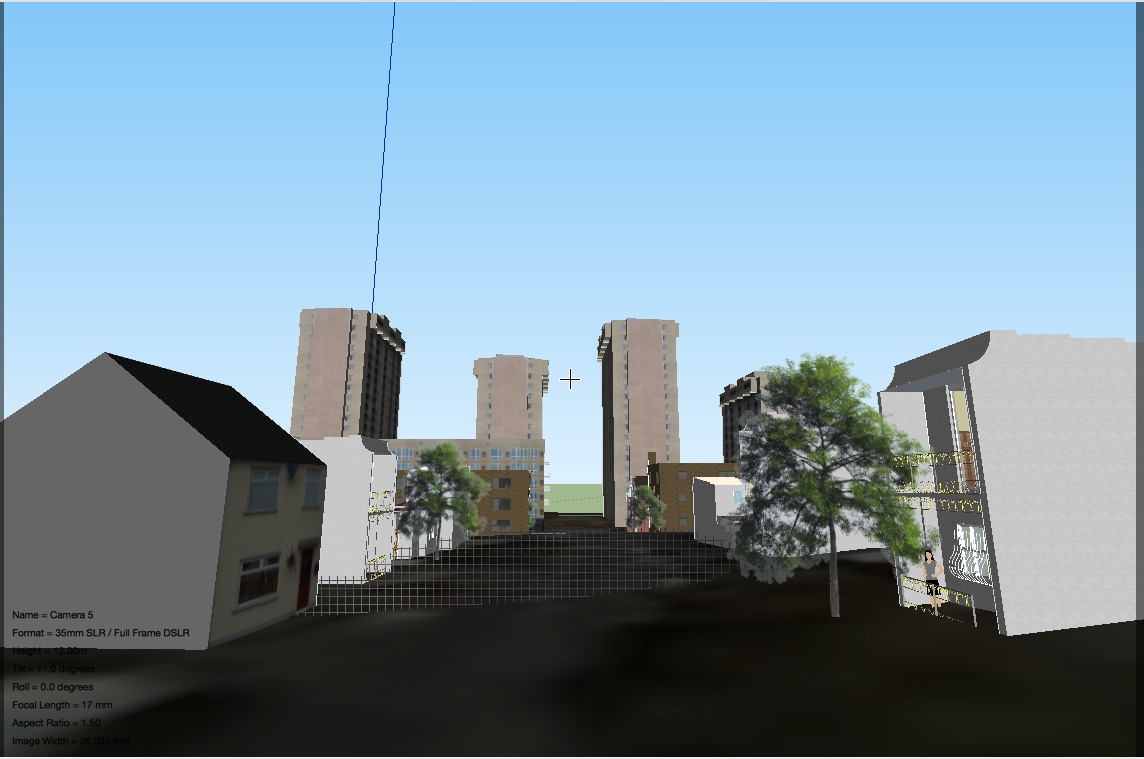
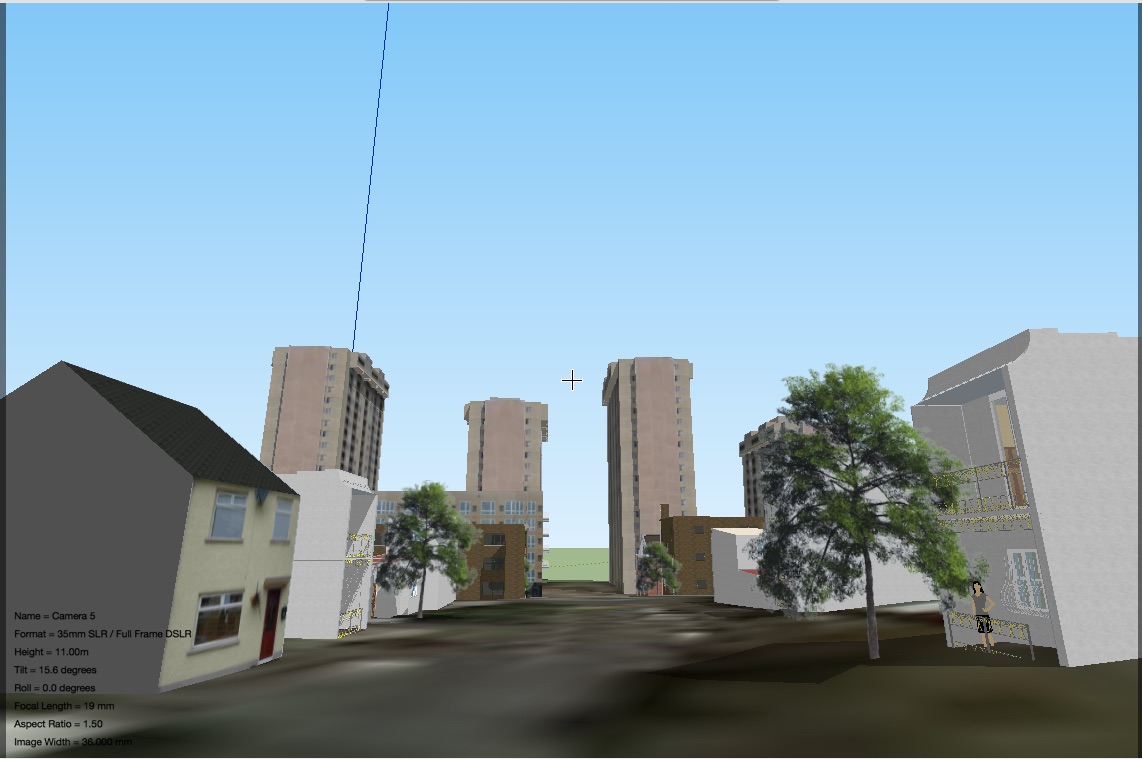
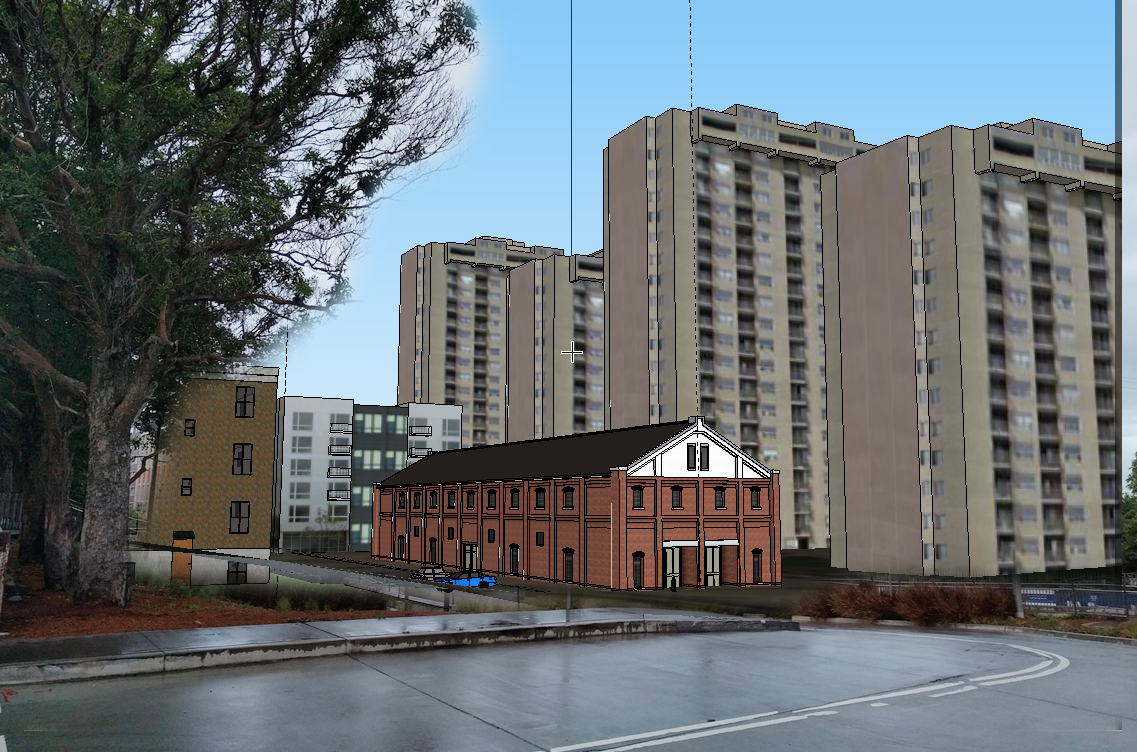
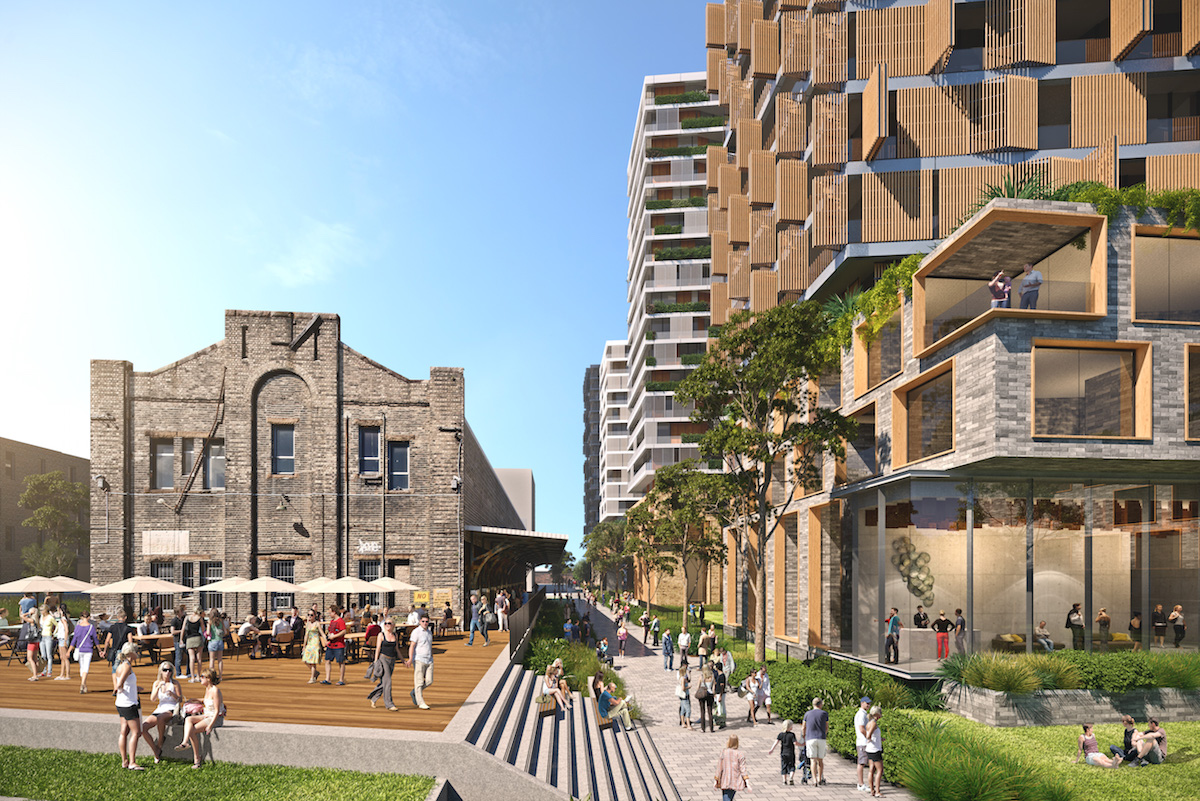
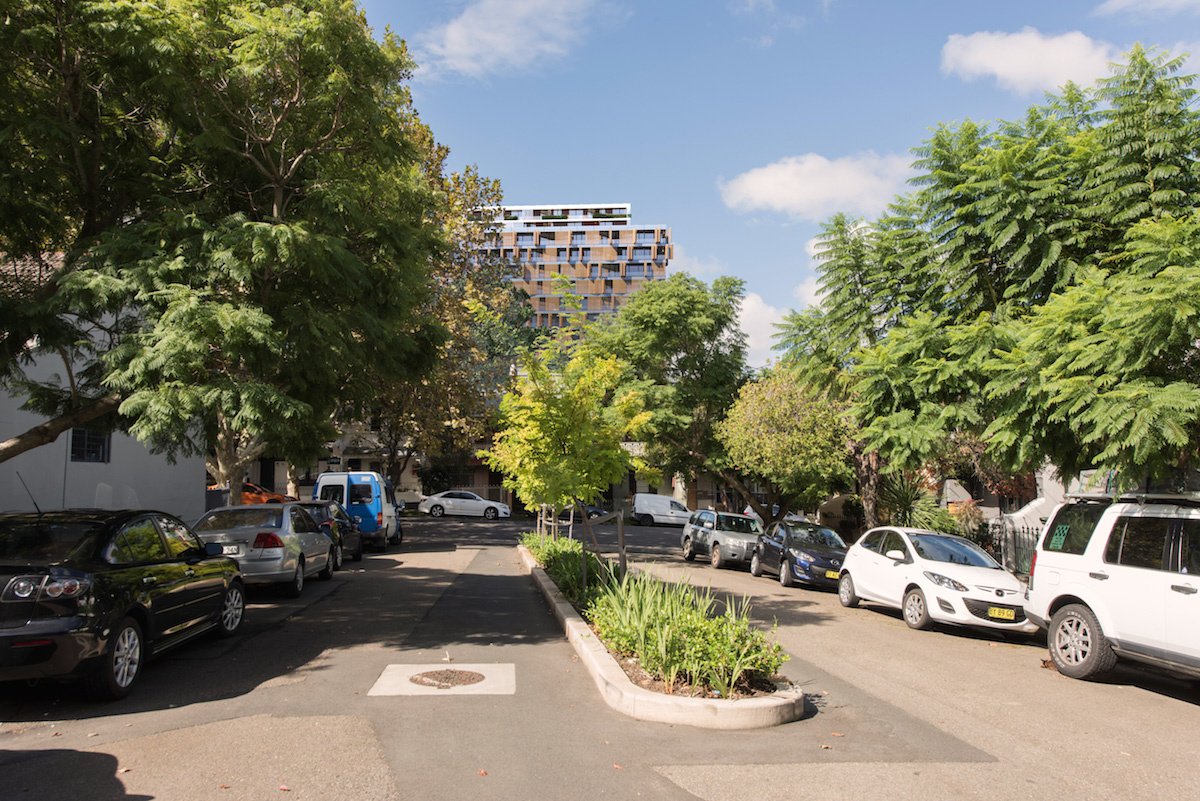
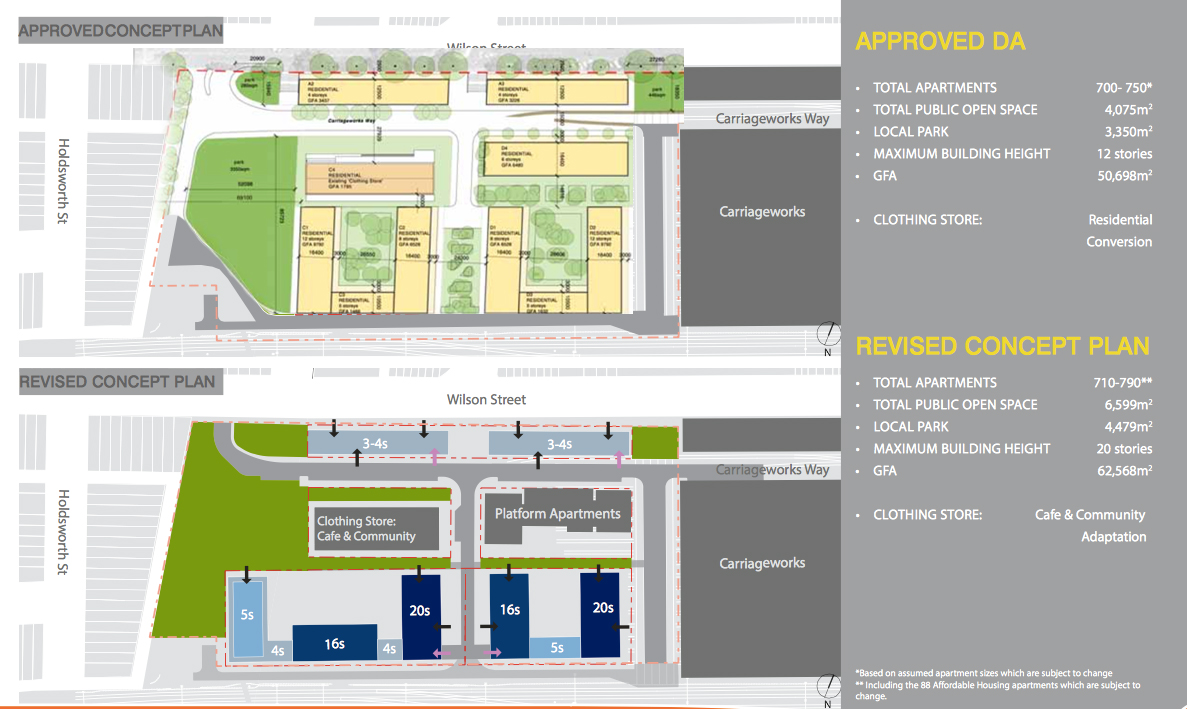
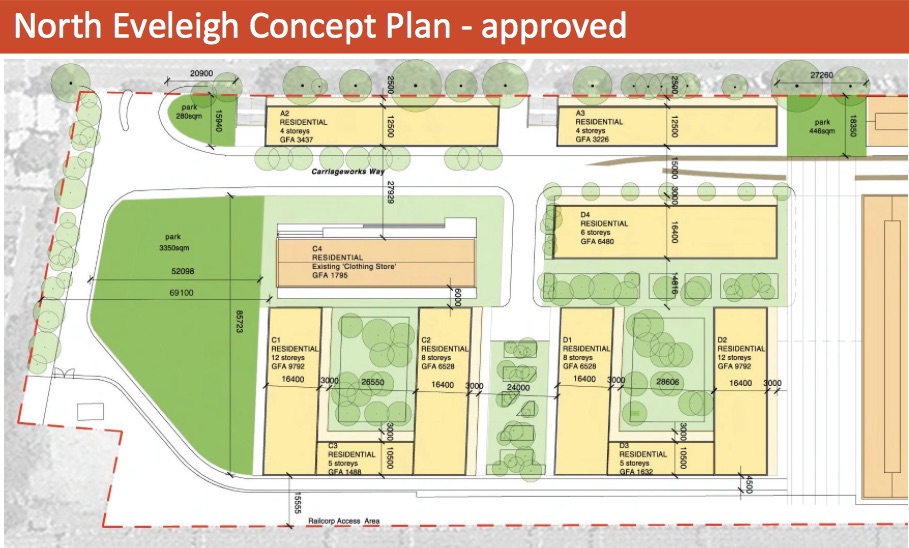
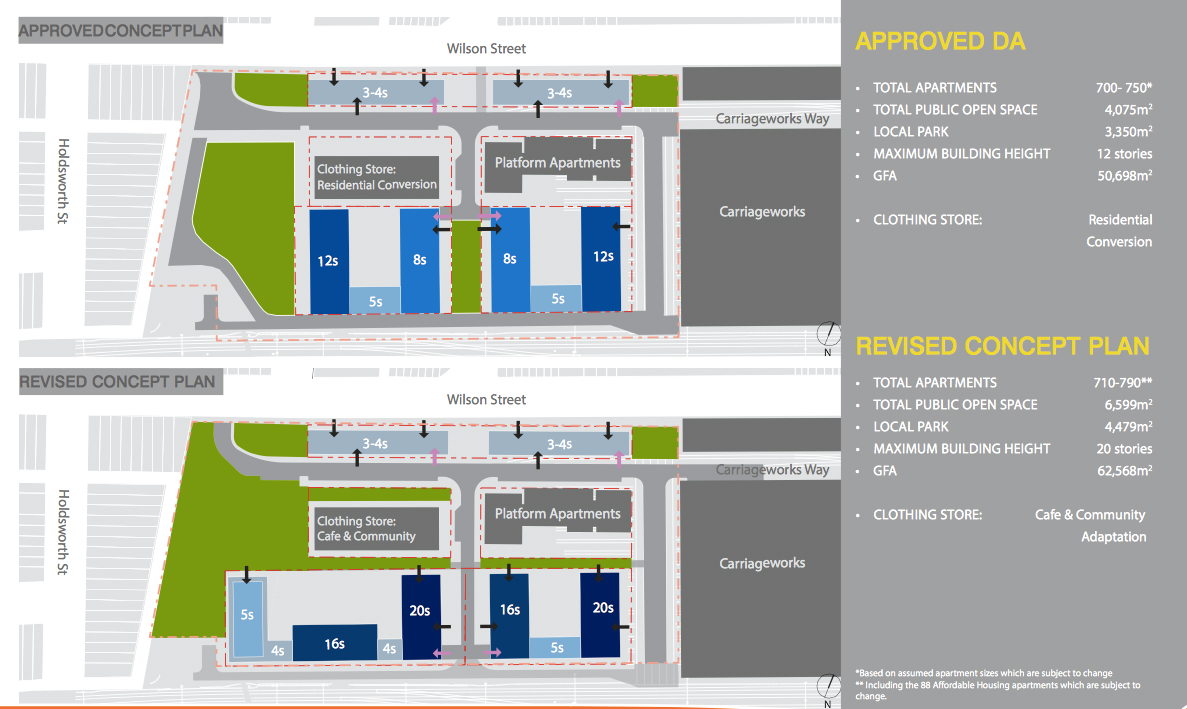
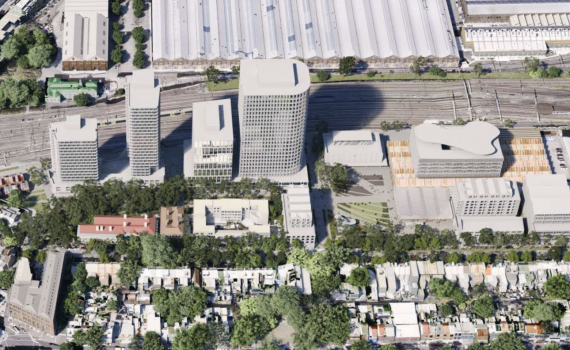
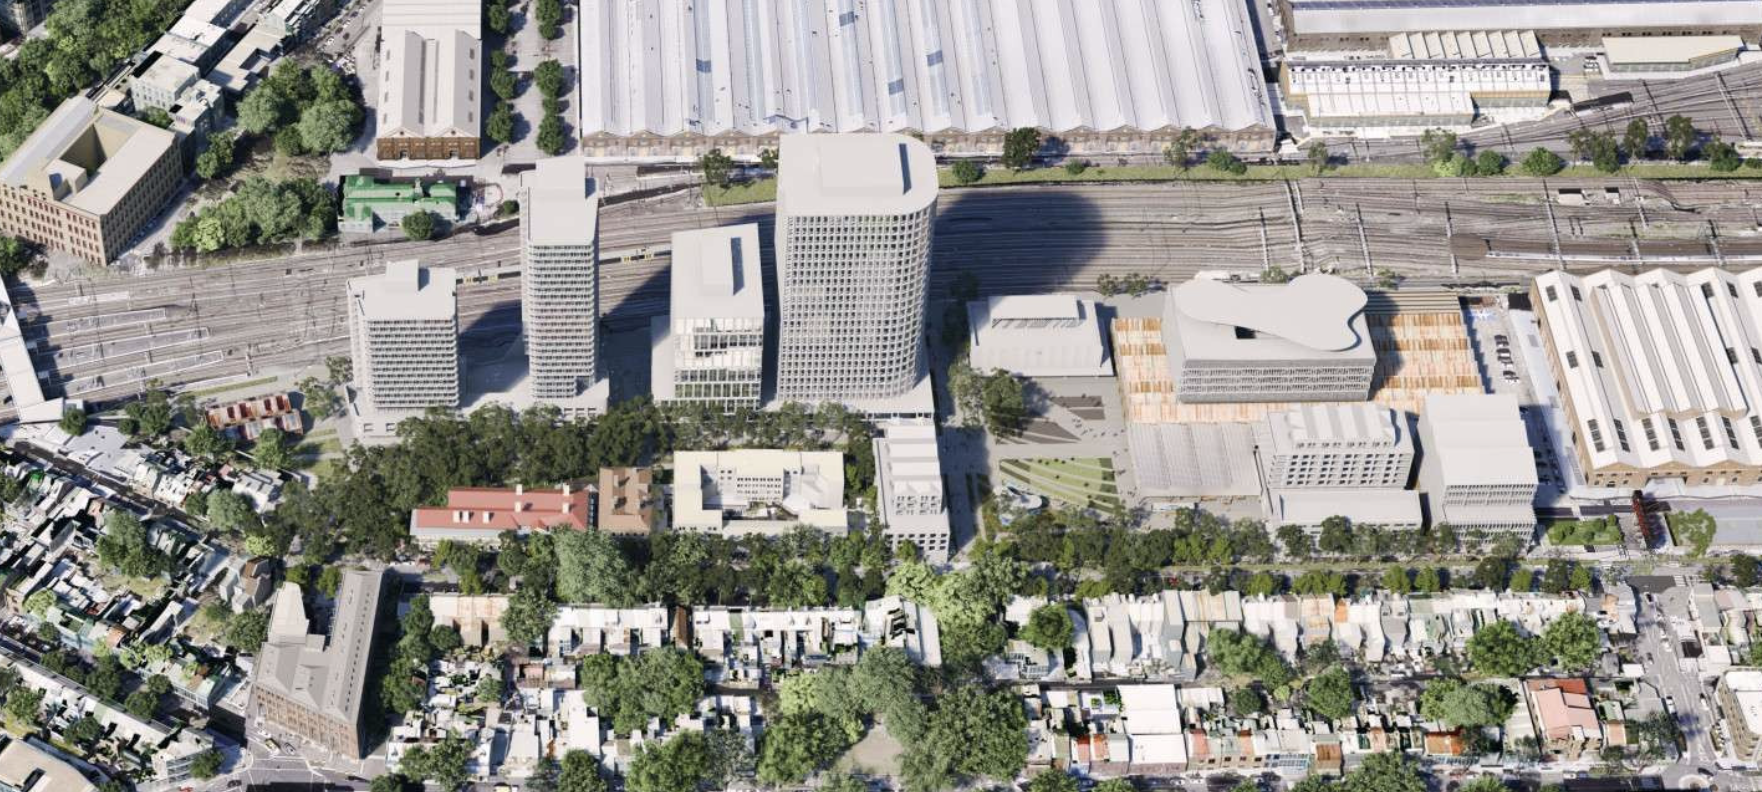
Within the proposed high density North Eveleigh West precinct we have an expected number of around 1600 residents in the new 3.02 ha development area. (700 new apartments plus the existing 88 Platform Apartments = 788 * 2.2 residents per dwelling, in a plan that exceeds local controls for Building Height and Floor Space Ratio)

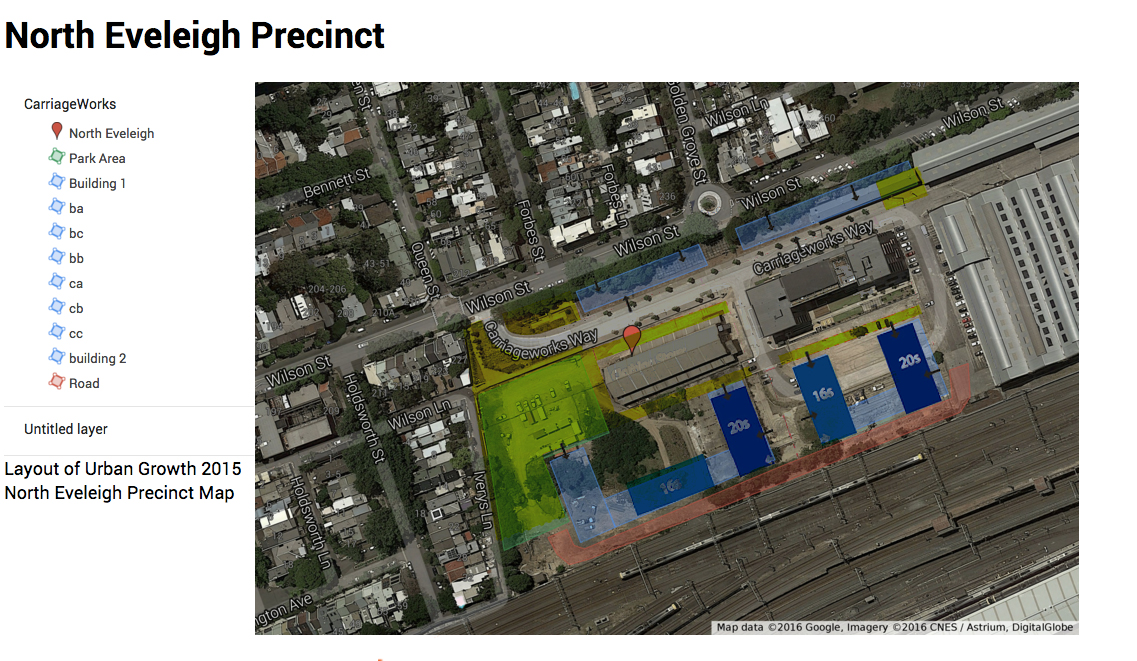
Referencing the below site comparisons it is VERY evident that the proposed 2016 North Eveleigh plan has the highest population density on the smallest parcel of land. How much Public Open Space is provided for this vibrant new neighbourhood?

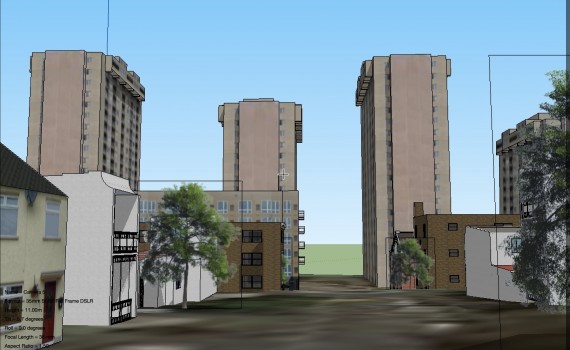
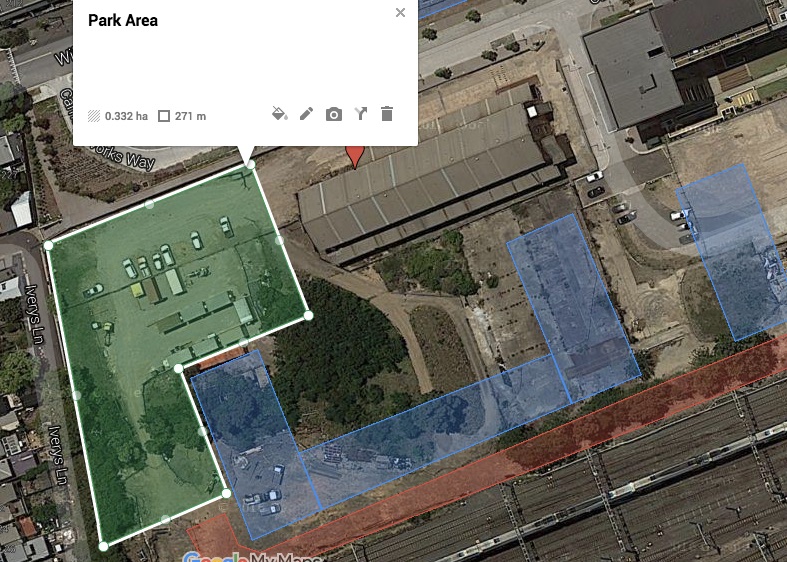
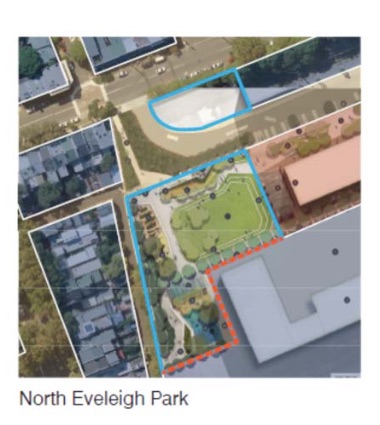
The planned public open space park in the South West of the development is 0.35 ha.  Including unusable verges in the entryway  0.43 ha public open space offered ! 

2016Park

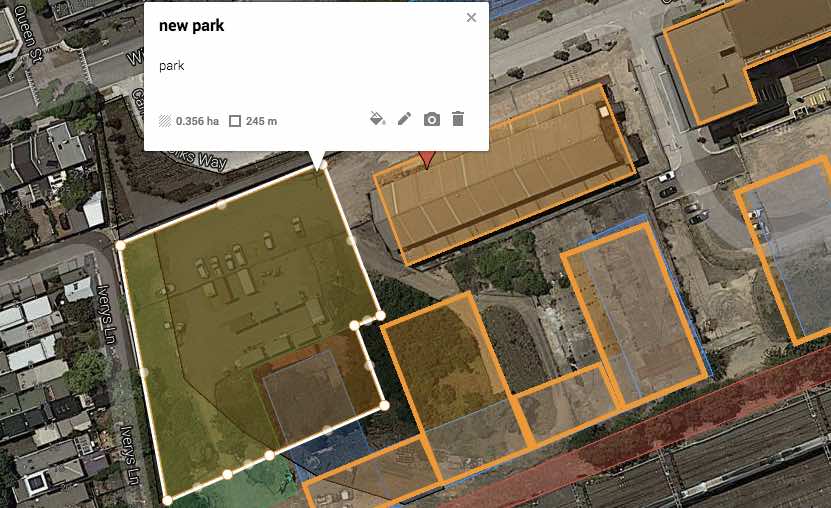
It should be noted the Urban Growth NSW continually over inflate the size of the Park. (as well as other misguiding numerics) Currently stated at 0.46 ha (including the entrance above the park which is technically open but in reality its just a pathway – the 2008 plan only included the physical .33 ha park in calculations) the Park size is also mentioned in Central to Eveleigh Documentation as 5,000 sq meters.  This is VERY concerning as the over inflated Open Space claims will obviously look more favourable to Authorities in their determinations. 


C2EPark - March Update

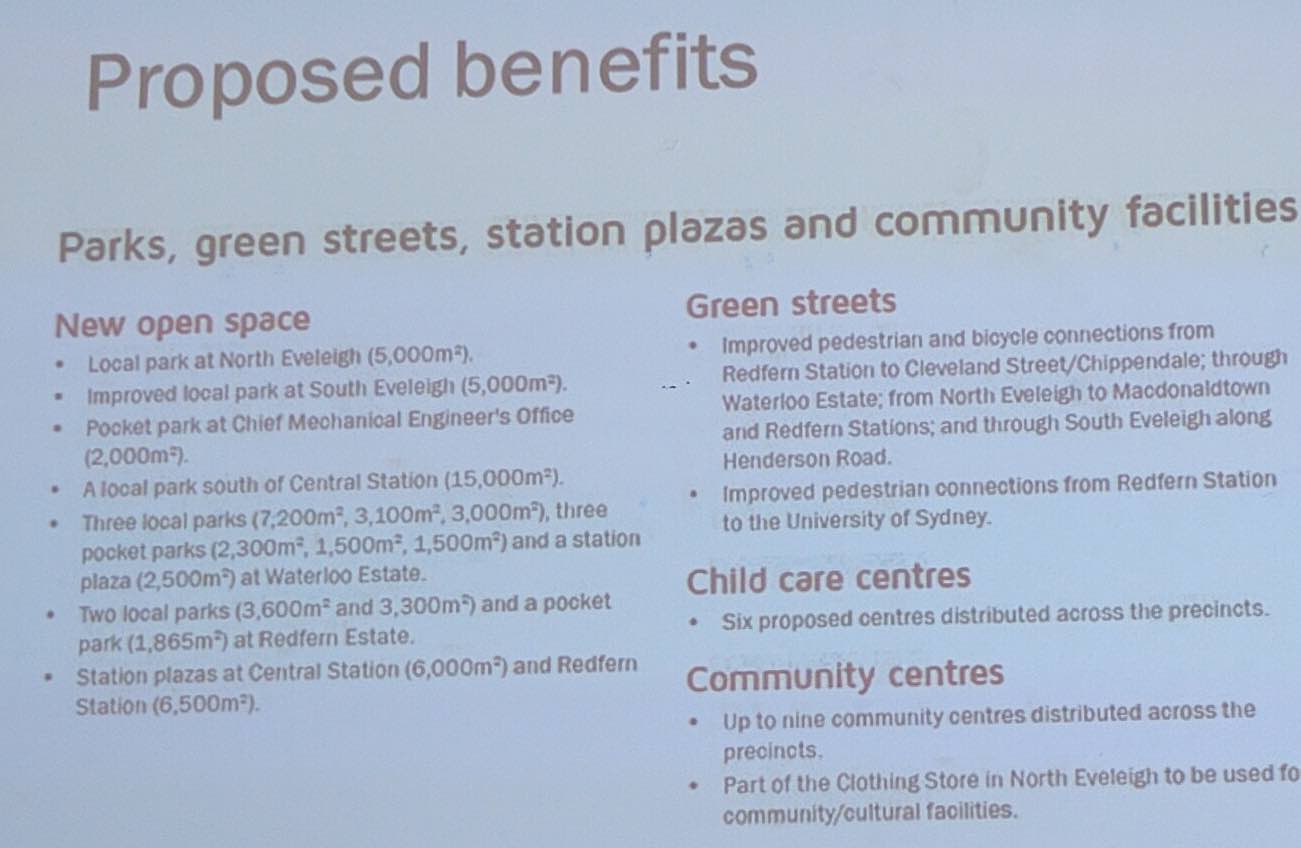
North Eveleigh Local Park stated as 5000m2 at C2E Update Meeting – March 31 2016

What is Open Space

NSW Dept of Planning states:

“Open space is the publicly owned land that is set aside primarily for recreation, nature conservation, passive outdoor enjoyment and public gatherings. This includes public parks, gardens, reserves, waterways, publicly owned forecourts and squares.”

Open Space is defined into 3 areas:

Regional Open Space (above 5 hectares) – are valued and visited by a broader catchment of people as well as the local community. e.g. Sydney Park

District Open Space (between 2 – 5 hectares) – are valued and visited primarily by people with the corridor providing facilities that include organised and unstructured sport and recreation activities. e.g. Victoria Park

Local Open Space (between 0.5 – 2 hectares) – provides a diversity of character and facilities that appeal to the local community at a neighbourhood level. A 400 metre walkable distance is used for Local Open Space. (8)  e.g. Hollis Park 

According to the Recreation and Open Space Planning Guidelines for Local Government (Department of Planning, 2010), the locally appropriate provision standard for recreational open space in Inner Urban areas within Metropolitan Sydney should be around 15 percent of an LGA’s (Local Government Area) share of non-industrial land (9% for Local/District Open Space and 6% for Regional Open Space) to ensure that there is a 1.5-hectare park within 1 kilometre of most dwellings and a 1000-square metre ‘pocket park’ within 400 metres of most dwellings to provide for neighbourhood needs.

This is great as it works for the current existing community but we are injecting 1600+ new residents into the area (more when North Eveleigh North (other side of carriage works) comes online. These percentage based Open Space measurements don’t take into account population DENSITY.

Urban Growth NSW have two new Pages on their Website about Density. They don’t really say anything specific but its nice that they are there…

What is Density Well Done

Density Design Principles
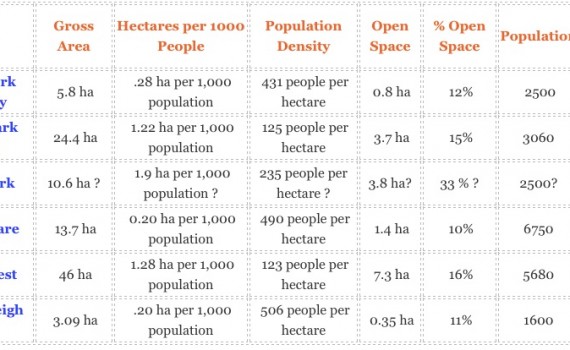
 

Site Comparisons 

Site Gross Area Hectares per 1000 People Population Density Open Space % Open Space Population OS m² per person
Central Park Broadway  5.8 ha  .28 ha per 1,000 population  431 people per hectare  0.8 ha  12%  2500  3.2m²
Victoria Park Zetland  24.4 ha  1.22 ha per 1,000 population  125 people per hectare  3.7 ha  15% 3060 12.0m²
Harold Park 10.6 ha ?  1.9 ha per 1,000 population ? 235 people per hectare ? 3.8 ha? 33 % ? 2500? 20 m² ?
Green Square  13.7 ha  0.20 ha per 1,000 population  490 people per hectare  1.4 ha  10% 6750 2.0m²
Rhodes West  46 ha  1.28 ha per 1,000 population  123 people per hectare  7.3 ha  16% 5680 12.8m²
North Eveleigh West  3.09 ha  .20 ha per 1,000 population  506 people per hectare  0.35 ha  11% 1600 2.1m²

The above shows an alarming trend in High Density – Low Area Developments that are Packing people into smaller areas and offering less Open Space. As an example South Australia legislates 12.5% of land is to be used for open space which relates to around 4ha per 1000 people in a lower Density development area of 35 ha. It does not make sense that this “percentage ratio” can be used in Higher Density developments. Some studies suggest that an increase in open space is required to compensate the increase in density with people having less private open space. (4)

 (Harold Park DCP specified a minimum of 25% to be used for public open space – excluding Private open space)

(Green Square DCP also specified a minimum of 25% of land to be used for public open space – excluding Private open space, although the above seems to contradict that)

(North Eveleigh 2008 Guidelines response to the Director Generals Report that recommended  25%-30% of land to be used for public open space(page 5).  

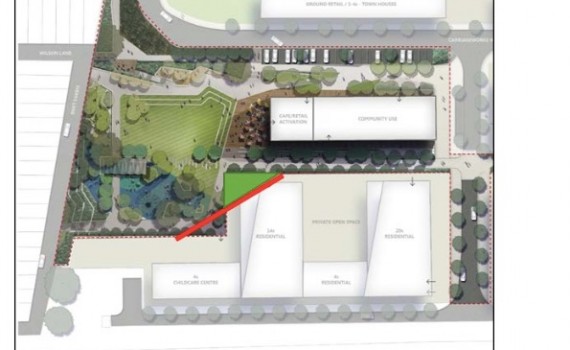
With the new 2016 Proposals we appear to have gone from 10m² per person to 2m² per person. Private Open Space within the 2 Superlots total 0.14 ha (thats 1400m²)

Some Background to Open Space Measurements

The relatively old metric used by NSW residential urban planners is to allow for 2.83 hectares of Open Space per 1000 residents within a development (1). The Density based benchmark benchmark takes into consideration that people in higher density dwellings need greater access and quality open space and public realm – their backyard is the public domain.

The standard of 2.83 hectares (7 acres) hectares of open space per 1000 population, which has been widely used in New South Wales and elsewhere in Australia, dates back at least to the 1940s. 1975 and 1985 survey reports noted the widespread practice in NSW of dividing the 2.83 ha into 1.21 ha for ‘active’ open space and 1.6 ha into ‘passive’ open space. Even current NSW Open Space Audits reference this metric (7).

This benchmark, a globally adopted maxim originally conceived in the UK, has in recent years been described as outdated and unrealistic in the planning of our new high density city centres. In practice, provision has varied considerably from the traditional formula of 2.83 hectares per 1000 people – from a Inner Sydney median of 1.6 ha to 6.32 ha for some outer council areas (dominated by sports grounds). The use of such a numerical standard to determine adequate levels of open space is said by some to be no longer generally accepted as a satisfactory method of Planning for open space (developers), yet it remains a well used reference guide and Yardstick for the adequate provision of open space (5)(6).  As the alternative ‘needs based’ measures and metrics are somewhat ‘holistic’ and at best sketchy in terms of actual metrics we still see current references to the original method as they are quantifiable (2)(3).

The Sydney Section 94 Developer Contributions plan makes estimates 5.5m² being available per resident by 2020 (p83).

http://sydneyyoursay.com.au/city-of-sydney-development-contributions-plan-updates/documents

Proposed updates to the Plan in early 2016 (Currently under review) are looking to reduce this figure to 2.1m² for each resident. Until updates to the DCP are ratified the plans must reflect the current documents.


Addressing Population Growth and Density

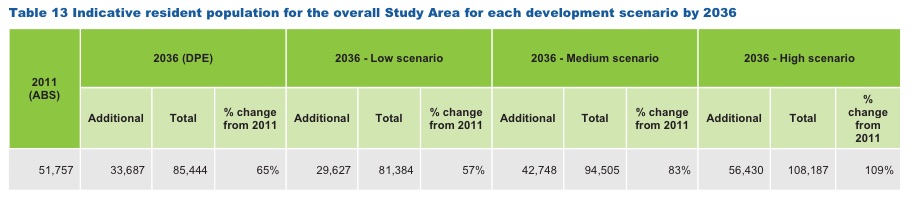
In the report on population growth projections UGNSW have used their own statistical calculations to measure population growth which are overall much higher than the Department of Planning & Environment (DPE) 2011 report.  We can see from table 15 that compared to the “2036 DPE estimation” of around 1100 residents for the North Eveleigh West precinct Urban Growth NSW has been using the “2036 UGNSW High Scenario” of 1600 residents. The reasoning used was UG thought the 2011 census data was incorrect and instead of using a population of 51 700 in the study area they have increased the starting population to 59000.(page 22). NOTE – This conflicts with table 4 on page 33 which suggests 56700 population. Why is this? Its not really clear but one reason is that they probably have to find a way to pay for Central to Eveleigh and the more properties they can build the more economically Viable the development appears. 

table15

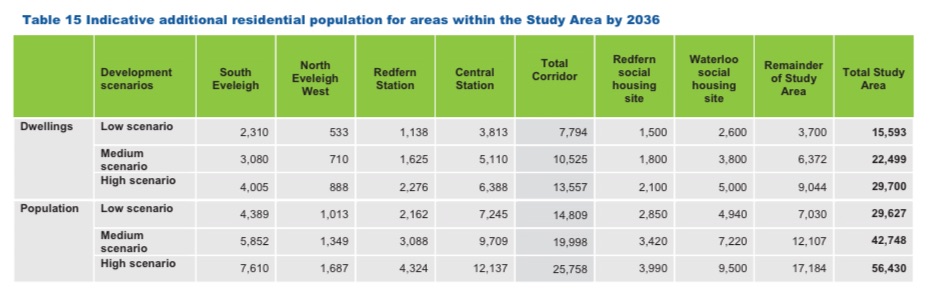
Table 13 below shows the overall potential population growth for the Study Area from 2011 to 2036 based on the predicted growth by the Department of Planning and Environment (DPE), and based on the low, medium and high development scenarios for the Central to Eveleigh project. (page 68)


table13NOTE 1 – “The City of Sydney is updating the Open Space & Recreation Needs Strategy 2006 and reviewing its Section 94 Contributions Plan 2006. The Council recently resolved that the Open Space, Sports and Recreation Needs Study will be prepared by the end of 2015” (page 81)

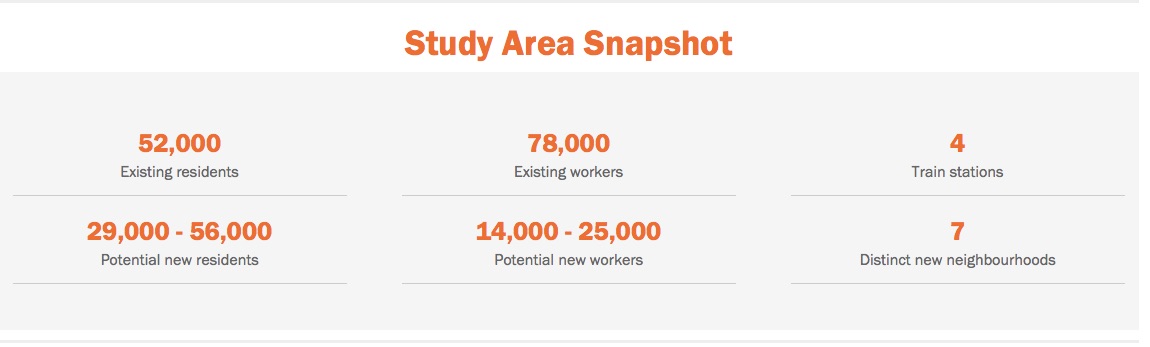
NOTE 2 – As of April 12 2016 the UGNSW website still states “potential new residents” as bw 29,000 and 56,000. So although Urban Growth are telling us they are not furthering discussions on building heights the below seems to suggest there is flexibility in density depending on the outcome of the overall proposition.

NOTE 3 – This article on News.com.au predicts by 2030 54,000 people will call Green Square home.

WebsiteSnapshot

The DPE report also claims that the rise in single-person and couple-only households, as well as an ageing population, is driving the need for smaller dwellings. It also showed how the government would create housing diversity, which included studio or “granny flats”, smaller block sizes in suburbia, an increased number of townhouses and terraces and manor homes (four separately titled units within the same building). This is not the case with the Urban Growth Central to Eveleigh plan. “Let’s not just build tower blocks at extortionate prices, let’s build dwellings that Australians are happy to come home to.”

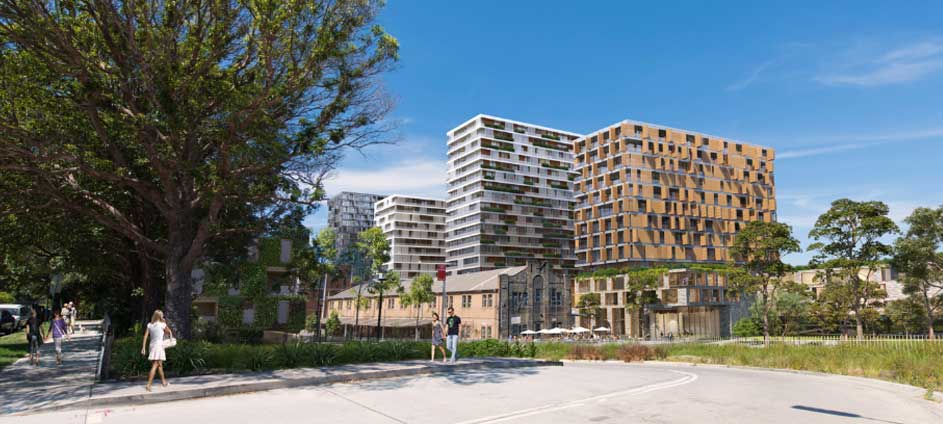
How do we get an acceptable result of Density and Open Space built to maintain a Vibrant Community?

The aim is to build communities where people want to live, not just build lots of 1 and 2 bedroom High Density rental stock. UG appears to be providing a market with specific customers in mind – ones without children.

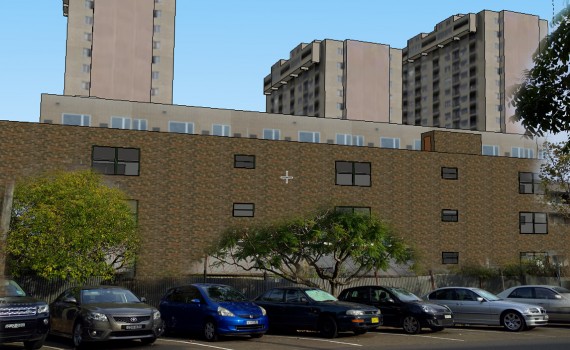
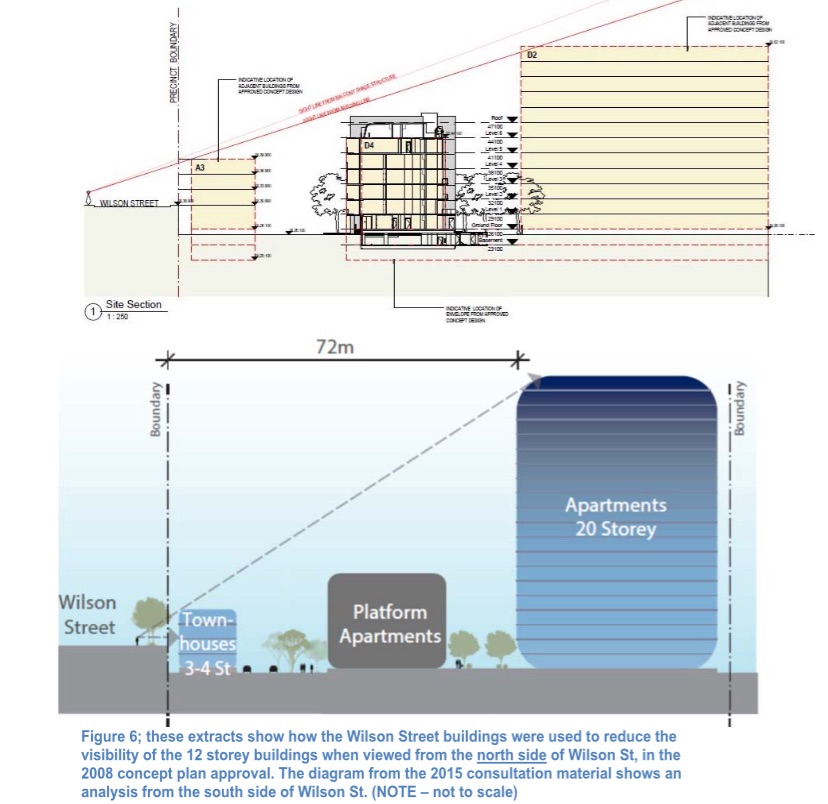
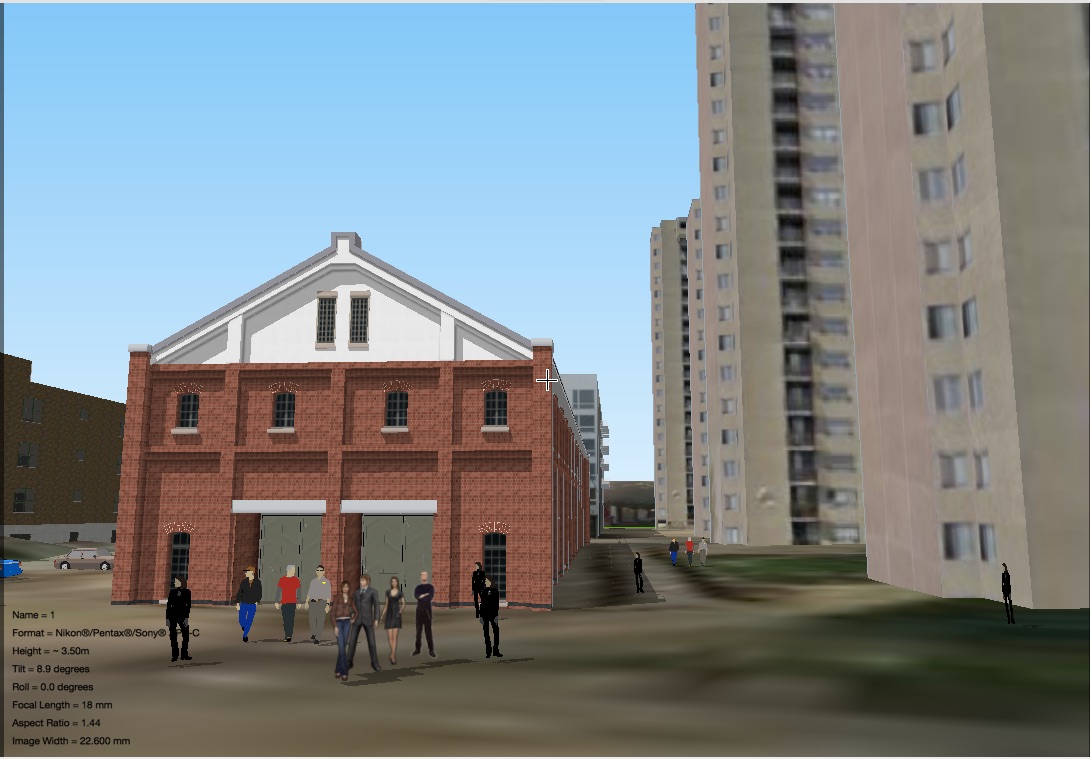
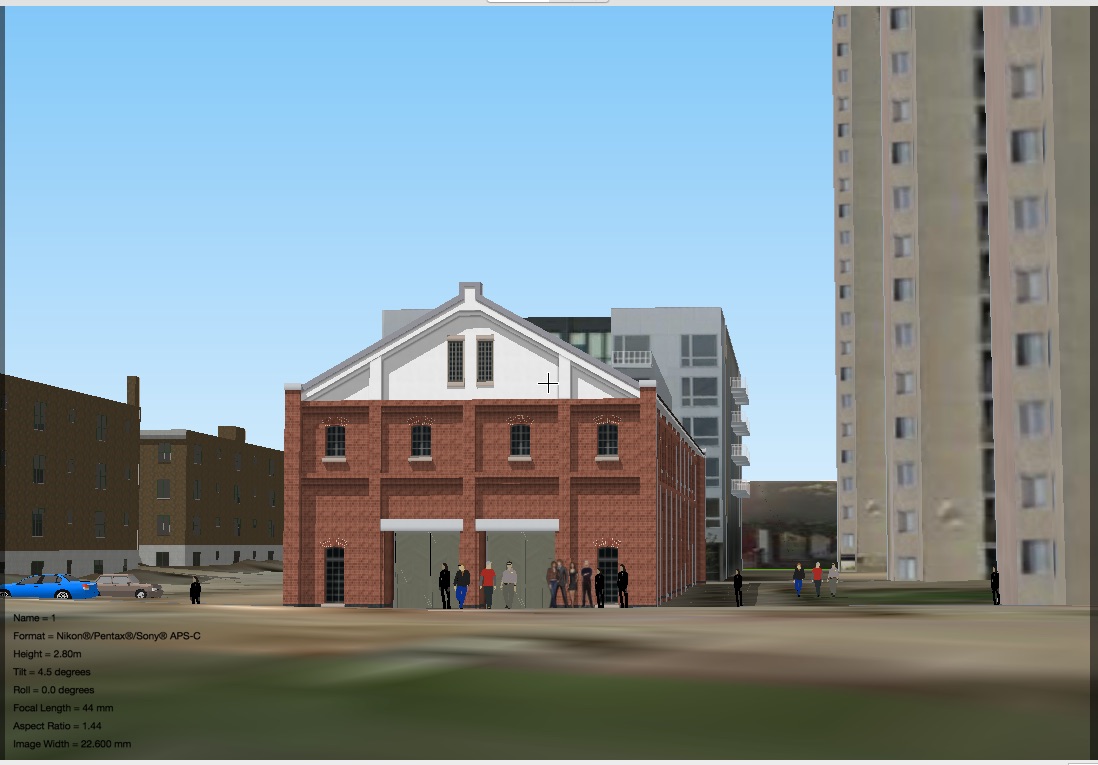
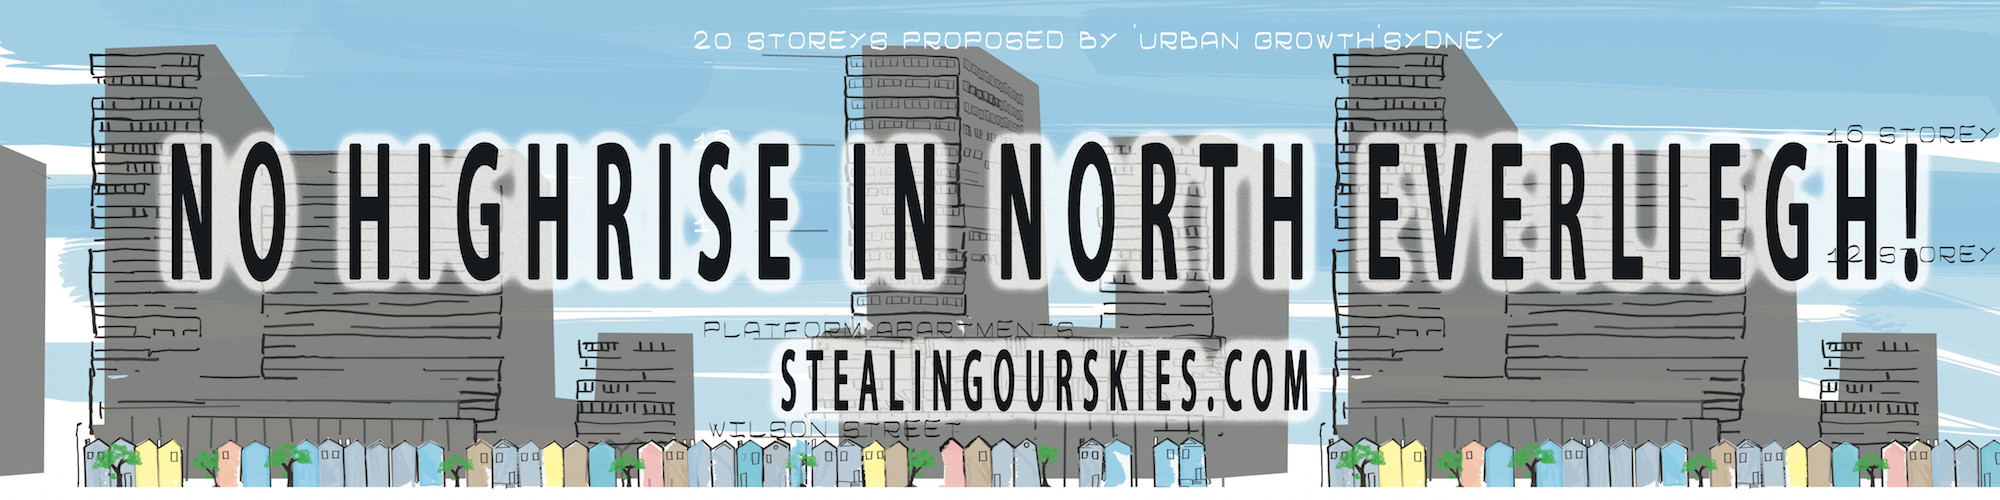
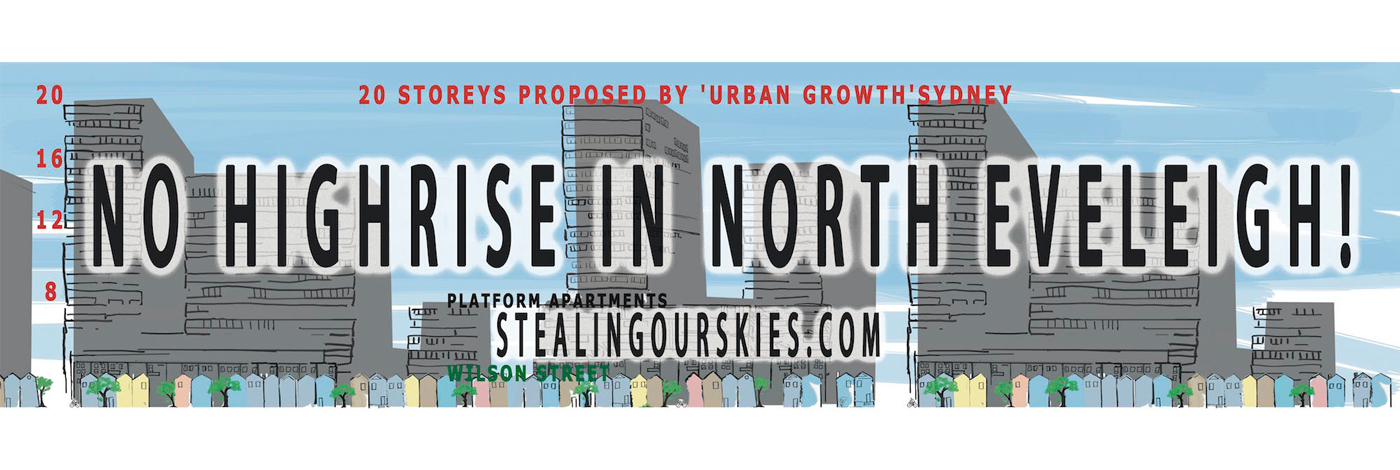
The most sensible result would be to reduce the population density to a figure that is more appropriate to what the space can provide. The original plan of 8-12 Storeys which would manage a proposed population of around 800 residents was better. The 2016 plan increased the density by 20% to provide 600- 700 apartments (equating to an additional 1400 residents on top of the 200 in the Platform Apartments). The 20% increase was based on “population growth and site specific design opportunities“. (page42 UGNSW – North Eveleigh – Plan for a new neighbourhood 2015).

Reversing that would leave us with 1120 residents immediately making more open space.

Additionally the NSW Government could follow through with changes to legislation making it harder for property owners to to leave the 10,000 CBD premises vacant.

It is quite obvious that UGNSW is reluctant to change the Density and building heights in North Eveleigh as it creates a precedent for the forthcoming developments in the Central to Eveleigh tract. In followup Posts we will put the facts together to present to the minister for planning  (and the shadow minister) as Urban Growth have made it quite clear they are not moving on this.

The Report from Charles Sturt University offers some fantastic references to many recent case studies on open space consideration in High Density residential areas (4). The benefits of Open Space is obviously necessary to urban planning and is backed up by the 100’s of Australian and International Reports on the subject.  The benefits are generally outlined in Social, Economic and Environmental impacts.


REFERENCES

(1) Density Health Workshop Report NSW

(2) https://thebayssydney.com.au/wp-content/uploads/2015/10/BaysPrecinctStrategicFrameworkReportVol1.pdf?2274ba&2274ba

(3) Sydney Open Space Report 2016

http://www.planning.nsw.gov.au/en/Plans-for-Your-Area/Sydney/Sydney-Districts/~/media/7621E08C4AE24C9FBC4970D3438A4C9A.ashx

(4) Best Practice Open Space in Higher Density Developments (2011)

https://www.charlessturt.sa.gov.au/webdata/resources/files/Best%20Practice%20Open%20Space%20in%20Higher%20Denisty%20Developments%20-%20Report%201%20Research%20Findings%20-%2022%20June%202012%20-%20FINAL.pdf

(5) PP01_WP11_Open Space Standards_2009_E3.pdf

(6) http://www.planning.nsw.gov.au/~/media/Files/DPE/Plans-and-policies/appendix-j-open-space-and-community-facilities-assessment-kellyville-station-precinct-2015-12.ashx

“The current default in many parts of NSW is a rate of 2.8ha per 1,000 new residents. This rate features in a number of planning frameworks, including the NSW Government’s Growth Centres Code and local government open space strategies and development contributions plans3. As an alternative, the Guidelines suggest a default rate of 15% of non-industrial land be allocated for open space purposes.”

(7) http://www.planning.nsw.gov.au/~/media/Files/DPE/Reports/central-district-open-space-definitions-sydney-open-spaces-draft-audit-summary-2016-02-29.ashx

(8) http://www.planning.nsw.gov.au/~/media/Files/DPE/Strategy-documents/draft-sydenham-to-bankstown-corridor-strategy-open-space-and-recreation-strategy-2015-05-25.ashx

(9) http://www.planning.nsw.gov.au/~/media/Files/DPE/Strategy-documents/draft-sydenham-to-bankstown-corridor-strategy-open-space-and-recreation-strategy-2015-05-25.ashx


(10) https://www.sa.gov.au/__data/assets/pdf_file/0016/17530/Best_Practice_Open_Space_in_Higher_Density_Developments_Project_Summary_Report_June_2012.pdf

(11)http://www.ugdc.nsw.gov.au/sites/default/files/file_root/PDFs/Precincts/Redfern_Waterloo/North_eveleigh_concept_plan/Electronic_copy_DOP/Appendix%206%20Residential%20Flat%20Code.pdf
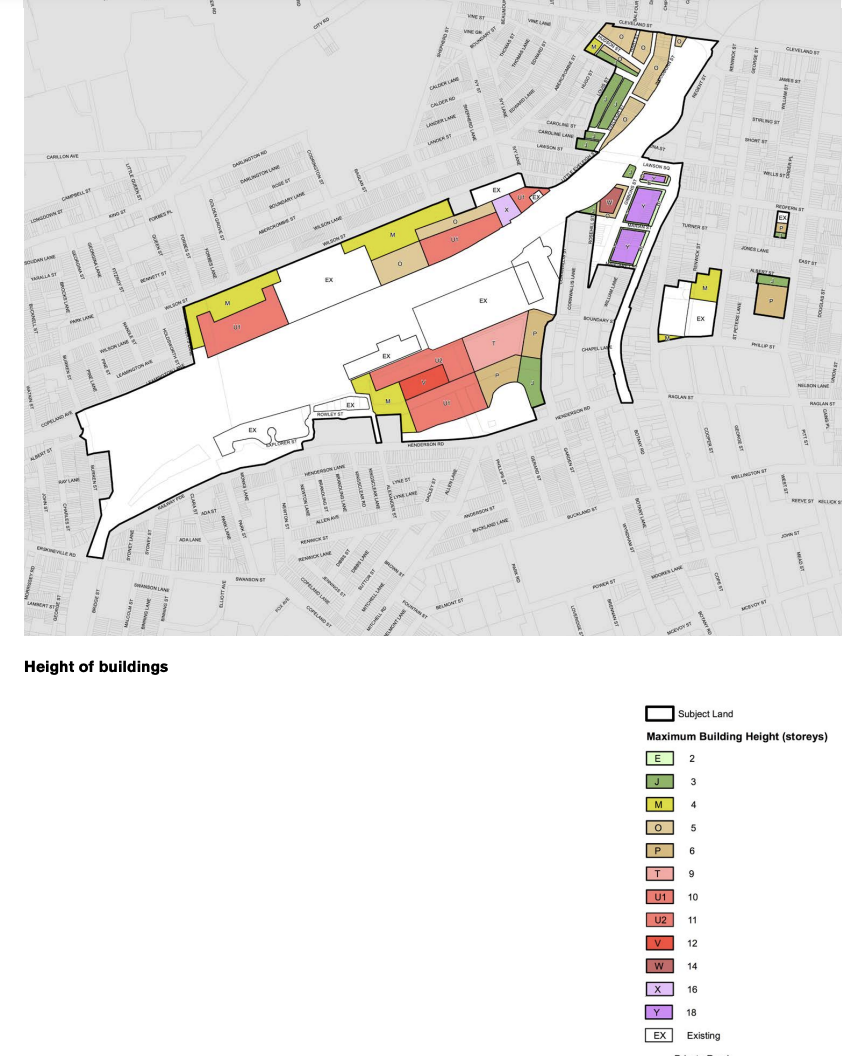
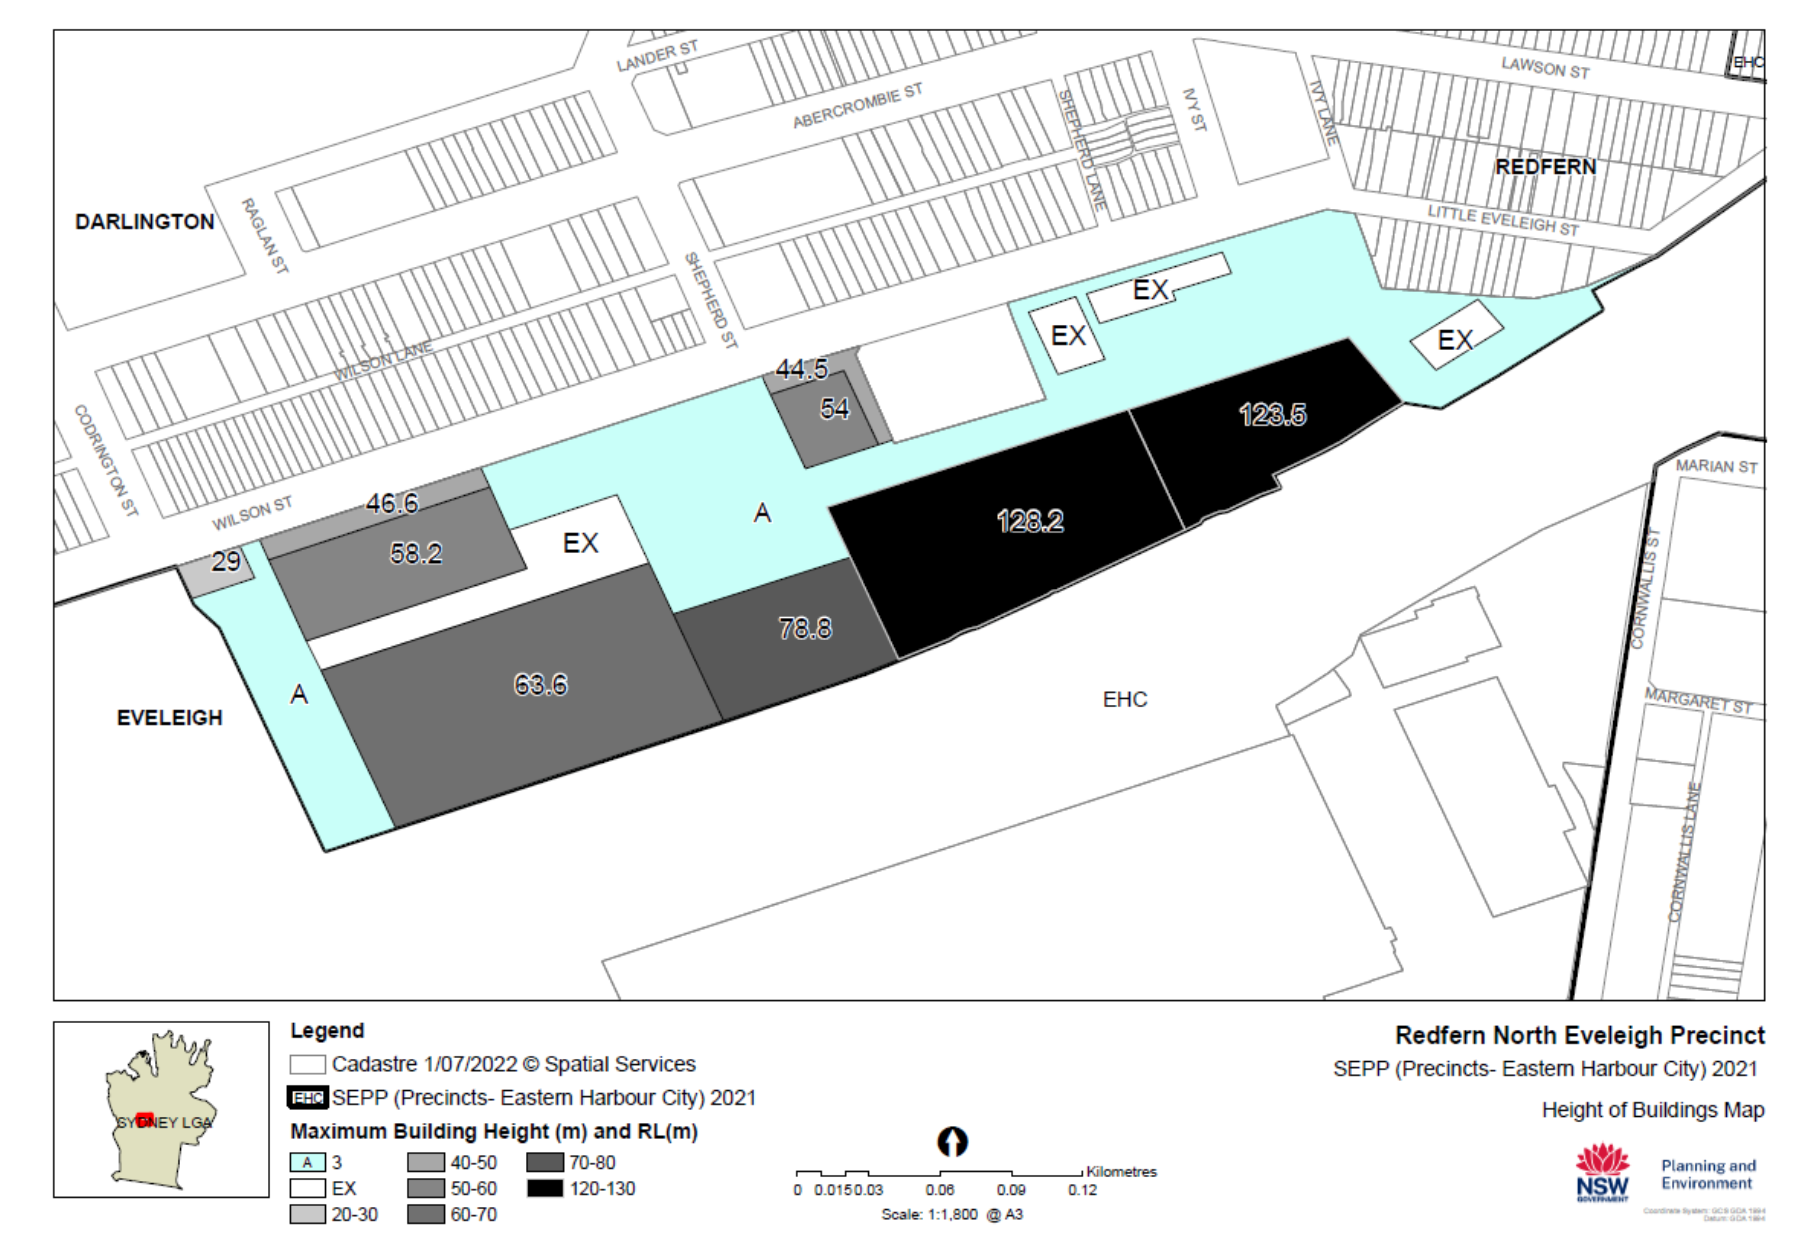
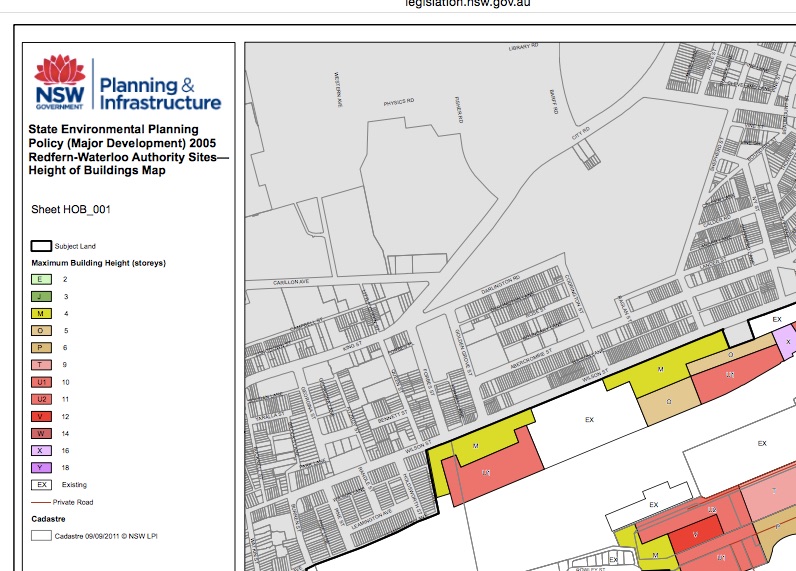
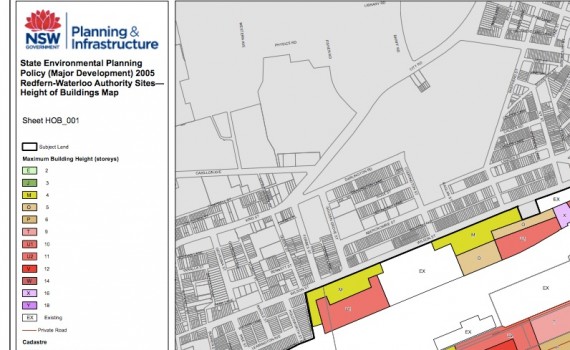
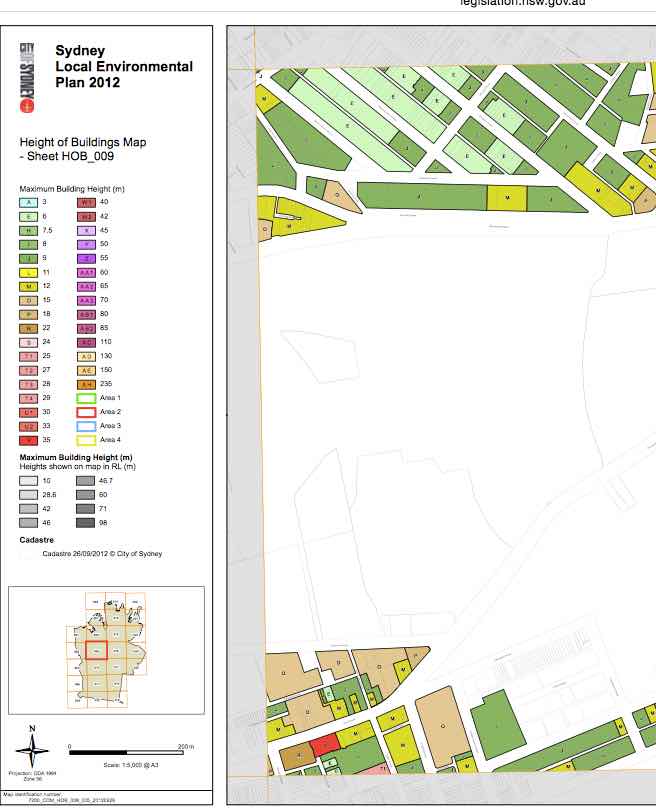


  • 1
FloorSpaceRatio Map

Urban Growth NSW’s 2016 North Eveleigh Plan exceeding allowable Floor Space Ratio (FSR)

Tags : 

2016 North Eveleigh development proposal is exceeding allowable FSR (Floor Space Ratio) 

State Environmental Planning Authority 2005 Redfern Waterloo Map states a maximum FSR (Floor Space Ratio) of 2:1 is allowable in the Site.

Not only is Urban Growth NSW’s current 2016 plan exceeding the permissible building heights for the area (which is 10 Storeys) they are also exceeding the allowable Floor Space Ratio for the buildings.

Allowable Floor Space Ratio = 2:1

Superlot 1 FSR = 6.2:1

Superlot 2 FSR = 5.4:1

Superlot 3 FSR = 2.7:1

calculations below

FloorSpaceRatio Map

Building Height Map


Floor Space Ratio defines the permissible physical size of development allowed on a piece of land.

A guide for calculations can be viewed in this PDF here supplied by planning.nsw.gov.au.  Height and Floor Space Ratio PDF  

The FSR Calculation is defined as  Gross Floor Area / Site Area

  • Site Area” is the size or area of the Lots upon which the buildings will be built. (does not include areas such as parks, walkways and public streets/roads)
  • Gross Floor Area” (GFA) is the area of internal walls within each floor of a building. (does not include such areas as stairwells and Lift shafts, Ventilation Ducts)

North Eveleigh West Superlots Site Area.

Allowable FSR = 2:1

Proposed GFA 57000 m²

SuperLot A    4000 m²

  • Storeys 20 – 4 – 16
  • GFA = 24800 m²
  • FSR  = 6.2:1

SuperLot B    4700 m²

  • Storeys 20 – 4 – 14
  • GFA = 25500 m²
  • FSR  = 5.4:1

SuperLot C   2500 m²

  • Storeys 3 – 4
  • GFA  = 6800 m²
  • FSR  = 2.7:1


As noted below there is a subclause in the Legislation (State Environmental Planning Policy (State Significant Precincts) 2005) that says the Building Height and FSR restrictions only apply where the minister for planning has not approved a Concept Plan. Until it is approved it is ILLEGAL. In other words he/ she can overrule the legislated restrictions.

It looks like it is up to us as a community to prove to the minister that good planning is NOT:

  1. HIGH POPULATION DENSITY   (506 people per hectare / 1600 residents within a 3.1 hectare precinct)

  2. ILLEGAL BUILDING HEIGHTS   (20 Storey Building Heights where 10 is legislated as the Max)

  3. ILLEGAL FSR   (up to 6.2:1 in an area legislated as 2:1)

  4. POOR ONISTE TRAFFIC (one point of entry and roads crossing public thoroughfares)

  5. INSUFFICIENT OPEN SPACE ( 0.32 ha Public Park for 1600 new residents)


  • -
Building Height Map

North Eveleigh Building Heights – Current NSW Legislation

Tags : 

Building Heights in NSW Legislation

This is part of an ongoing investigation into how Urban Growth NSW can come up with 20 Storey Building Heights on the proposed High Density North Eveleigh site. We have been recently told (Meeting 31 March 2016) that the proposed 20 Storey Heights are apparently “non negotiable”. Hearing that the main reason was the buildings minimal Solar shadowing (across the railway) and the forecast in population increase in Sydney we decided to have a look at the current Legislation.

On the City Of Sydney Planning Controls map it is noted that the North Eveleigh site is listed under the Redfern-Waterloo Authority which uses the following State Environmental Planning Policy (State Significant Precincts) 2005 (1).

North Eveleigh is also referenced below in the 2012 Sydney Regional Environment Plan 26 City West (2).

These legislative planning documents outline amongst other things, Building Height restrictions. The below references the current NSW Government Legislations available in regard to the North Eveleigh precinct.

(1) State Environmental Planning Policy (State Significant Precincts) 2005

According to the NSW Legislation Website “State Environmental Planning Policy (State Significant Precincts) 2005”, to which the North Eveleigh Precinct is part of, the Maximum building height allowed for the area is 10 storeys.

Redfern-Waterloo Authority SitesFloorSpaceRatio Map

Height of buildings Map    shows 10 storeys maximum

http://www.legislation.nsw.gov.au/map/SEPP_MD_RWA_HOB_001_20110913.pdf?id=88bf3142-d24c-e128-fad0-e65dcce1fcd2


Building Height Map


EDIT 5 April 2016 – The Current Legislation says  In Part 5 Section 21 : Note Clause 3

21   Height, floor space ratio and gross floor area restrictions

(1)  The height of a building on any land that is the subject of the Height of Buildings Map is not to exceed the maximum height shown for the land on that map.      (10 storeys)

(2)  The floor space ratio of a building on any land that is the subject of the Floor Space Ratio Map is not to exceed the floor space ratio shown for the land on that map.   (FSR 2:1)

(2A)  The gross floor area of a building on any land that is the subject of the Gross Floor Area Map, being land known as the Australian Technology Park, is not to exceed the gross floor area shown for the land on that map.

Note. The total maximum floor space ratio for the land to which this subclause applies is equivalent to 2:1.

(3)  This clause applies only in relation to development where the Minister has not, in an approval for a concept plan for the development (whether given before or after the commencement of this clause), provided for the construction of a building that exceeds the height, floor space ratio or gross floor area restrictions, or any combination of restrictions, set out in subclauses (1), (2) and (2A).

(2) Sydney Regional Environmental Plan No 26 City West

The 2012 Sydney Regional Environment Plan shows Building Height restrictions on the Streets surrounding North Eveleigh as 9 to 12 meters in Height.

Of Note the Plan additionally outlines planning Principles for the Eveleigh Precinct.

Division 3 Planning principles for Precincts specifies Planning Principles for the Eveleigh precinct:

  • Urban Design

    The height of new buildings should reflect and emphasise the topography of the Precinct, at the same time respecting the height and scale of heritage items.

    New buildings within the Precinct that are close to the Precinct boundaries are to respect the character and height of buildings in their immediate vicinity.

    Any such buildings should not compromise the environmental amenity, heritage significance and general scale of development in their locality.

    Development involving former railway buildings and associated items of heritage significance is to result in their conservation and re-use.

Sydney Local Environment Plan 2012


  • -
horizontal 1_small

North Eveleigh – Potential Build Timetable

Tags : 

Based on the April 2016 “UGNSW Information Sessions” we have the following Proposed Build Timetable:

March 2017          -> Concept Plans Approval with Detailed Construction Drawings

July 2017               -> Start Infrastructure Works, Roads, Parks and Clothing Store Overhaul   (Period 1 year)

July 2018               -> Sell SuperLots to Developers and Assess Designs

Dec 2018                -> Construction of SuperLots (High Rise) Begins. Potential for Staggered Construction of the 3 SuperLots each taking 12 to 18 months to complete.

December 2020  ->  Estimated Completion of North Eveleigh Precinct


  • -

March 2016 Update – North Eveleigh Development Proposals

Tags : 

Portal-Banner

A lot has been happening at StealingOurSkies over the last month

plans2Format

You will have seen our new Banners starting to go up around the neighbourhood. We are still looking for more houses to hang the banners. If you wish to help spread awareness please let us know. There are Vertical and Horizontal versions available.

Recent Posts on the website

(click on the links to visit the full post)


POST: March 30 – Central to Eveleigh and North Eveleigh Stakeholders Update Meeting

UrbanGrowthLogo

There is a meeting on the 30th of March 2016 for stakeholder and community organisations. We will report back the updates here on the website.


POST: The New proposed BIGGER park actually got SMALLER

Park Area

The claim that the new design for the North Eveleigh park is bigger in the new 2015 plan is yet another false and crafty attempt by Urban Growth NSW at tricking the figures and documentation to make their proposed changes appear more favourable. Using some “Google Love” we realise the park actually got smaller…


POST: Picking Holes in the Urban Growth NSW 2016 Plan

PlansCompare

More investigation of the new Urban Growth NSW 2015 North Eveleigh Plans and proposed claims.


POST: The Petition

The online petition has been now turned into an paper petition that can be more readily tabled in the NSW Parliament. You will see in coming weeks a paper petition being handed around to sign.  If you are keen to help volunteer some time to help door knock for signatures please let us know.


POST: City of Sydney responses to Urban Growths Plan

compareView

The City of Sydney officially responds to the 2015 Urban Growth NSW Plan with some interesting findings and ideas. 


Community Forums

Remember the community Forums are Live. If you have received this email you are already signed up and can voice your opinions and concerns here.


SavingOurSkies

To Unsubscribe from email notifications of new posts at StealingOurSkies please reply with “Unsubscribe” in the subject line.


  • -
Park Area

The North Eveleigh proposed 2015 Park Actually Got SMALLER !!!

Tags : 

Despite claims of a bigger park, with a little bit of Google Love I was able to prove the new 2015 plan actually made the “Local Park” smaller compared to the 2008 Plan.

When Comparing the actual area used to calculate “Local Park”, which is the area on the LHS of the above image underneath the entrance to Carriageworks Way, we can see the Area has not increased to the value of 4479 m² but actually decreased to an area of 0.332 ha. (3320 m²).

GoogleMapOverlay


parkCOS Park Plan Options

What else are Urban Growth tricking us with ?

  • Number of new Apartments ? – Should be more like 830 – 870 with a 20% increase in GFA

Saving Our Skies


  • -
plans2Format

Picking Holes in the Urban Growth NSW 2015 Concept Plan

Tags : 

Like everyone else I have had a hard time understanding the logic of Urban Growth’s new 2015 North Eveleigh Plans.

Ive spent a few too many days trawling through old and new documents and plans and have found the following:

  • The comparison between the indicative ‘Street View’ between the old and new plans is incorrectly placed and needs to be amended. The City of Sydney response to UGNSW submission found the same.  See Below.compareView


  • For some reason the number of apartments magically only rose from “710 – 750”  to “750- 790”, even with an increase from 12 – 20 Storeys.  The Comparison showing this (Fig.7)  is a little misleading and confusing. The GFA (Gross Floor Area) of the Western component of the 2008 plan is 57,506, including the 88 Platform Apartments and the use of the Clothing Store for 22 apartments for residential conversion (Fig.2). However in the comparison the old plan is stated as GFA 50,698 and has removed these two buildings out of the equation (7275) so the 2008 apartment count should reduce as well from 710 to 600. The difference now appears to make sense with a much bigger increase from 600 – 790**. 


North Eveleigh Approved Plan

Fig.2 North Eveleigh 2008 Approved Concept Plan

  •  The Original Concept Plan (link-page 19), which included both sites either side of Carriageworks, states a total Estimated Dwelling count of 1258, with 2400 new residents. Fig.5 indicates an estimated 1844 new residents which using the same math and division of apartment sizes (0.8% Studio, 31% 1 br, 45% 2 br and 14% 3 br) would have the new 2015 North Eveleigh West plan to actually contain bw 830 and 960 apartments.
ConceptPlanArea2

Fig.3 Original “North Eveleigh” Site boundary from 2008 Plan


ConceptPlanArea4

Fig.4 Original 2008 Concept Plan for 1258 new Apartments either side of Carriageworks.


  • One reason given for the Increased Height was that originally the Clothing Store was going to be residential. Searching back thru the documentation Bates Smart only predicted that 22 Dwellings could be placed in there. Using the average of 2.29 occupants per unit this would only account for an extra 50 people. Based on the Below estimated allocation of people this would only be one floor difference. NOT an additional 8 Storeys!
EstimatedResidents

Fig.5


  • The comparison documents comparing the Plans old and new are visually adapted to look in favour of the new plan.
  • The Increased Park size (3500 sq m – 6500 sq m ) has really only been achieved by deleting the ring road (which was quite useful so all traffic was not using the one thoroughfare) and slightly changing the appearance of the before and after Pictures. Notice how the new park area in the actual documentation looks to be much more generous.
PlansCompare

Fig.6 Old 2008 Plan overlaid over new comparison image from 2015 Plan Documentation.


As compared to this….


PlansCompareOrig

Fig.7 Comparison Image as shown in new 2015 plan.


Forum Login

UserOnline

Users: 5 Guests