North Eveleigh – March 2016 Plan – High Density Living and Open Space Provision – A Vibrant Community Heart?
High Density and Open Space Provision in North Eveleigh 2016 ?
- What is Open Space
- Site Comparisons
- Background to Open Space Measurements
- Addressing Population Growth and Density
- How do we get an acceptable result of Density and Open Space built to maintain a Community
- References
Within the proposed high density North Eveleigh West precinct we have an expected number of around 1600 residents in the new 3.02 ha development area. (700 new apartments plus the existing 88 Platform Apartments = 788 * 2.2 residents per dwelling, in a plan that exceeds local controls for Building Height and Floor Space Ratio)
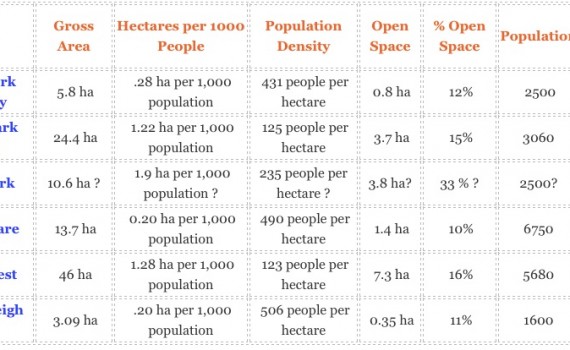
Referencing the below site comparisons it is VERY evident that the proposed 2016 North Eveleigh plan has the highest population density on the smallest parcel of land. How much Public Open Space is provided for this vibrant new neighbourhood?
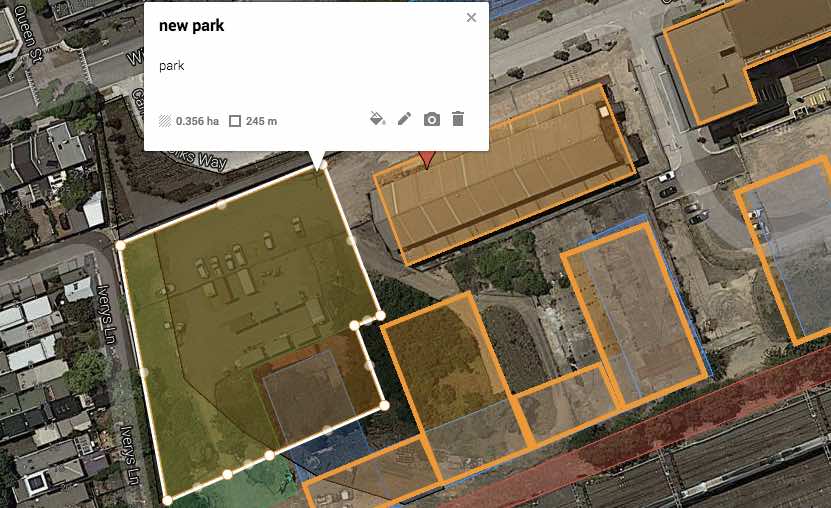
The planned public open space park in the South West of the development is 0.35 ha. Including unusable verges in the entryway 0.43 ha public open space offered !
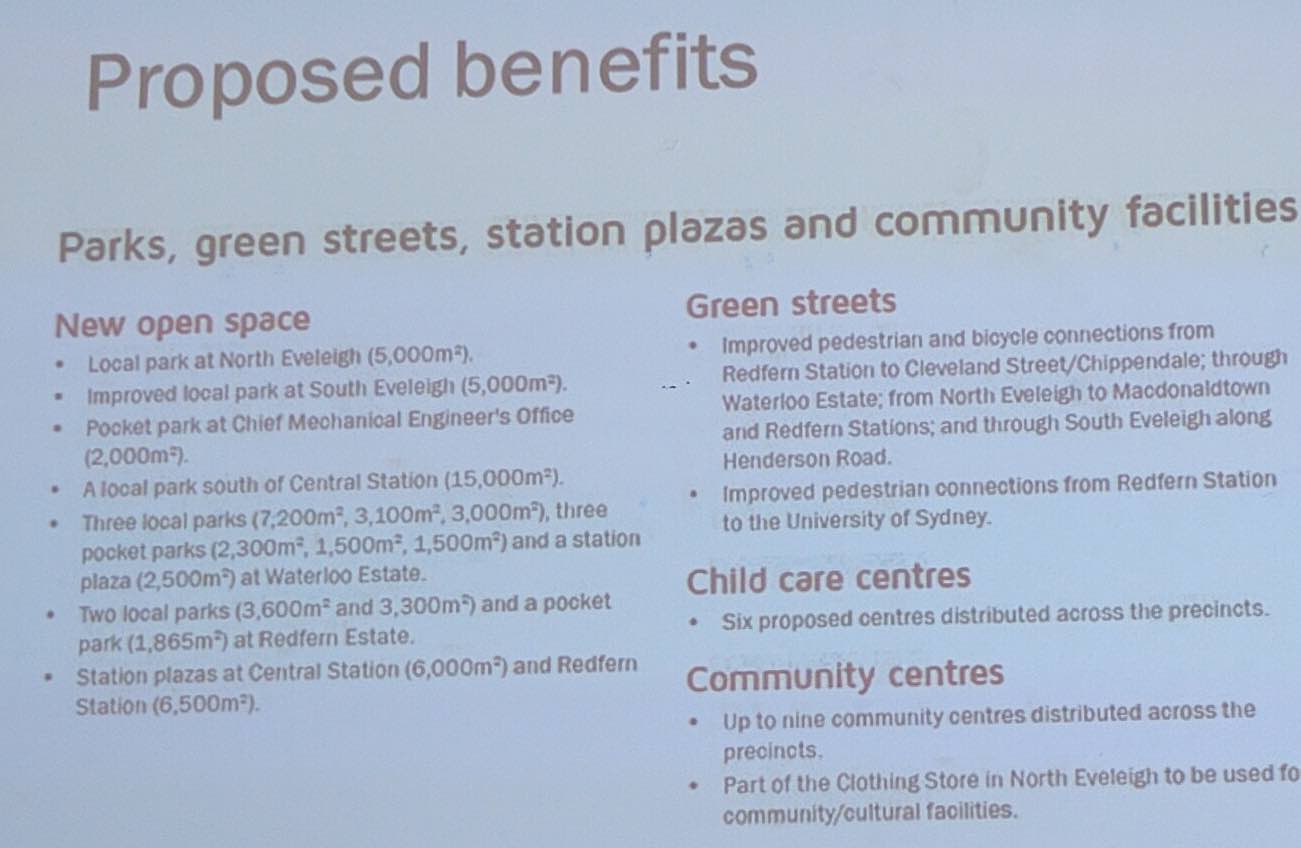
It should be noted the Urban Growth NSW continually over inflate the size of the Park. (as well as other misguiding numerics) Currently stated at 0.46 ha (including the entrance above the park which is technically open but in reality its just a pathway – the 2008 plan only included the physical .33 ha park in calculations) the Park size is also mentioned in Central to Eveleigh Documentation as 5,000 sq meters. This is VERY concerning as the over inflated Open Space claims will obviously look more favourable to Authorities in their determinations.
What is Open Space
NSW Dept of Planning states:
“Open space is the publicly owned land that is set aside primarily for recreation, nature conservation, passive outdoor enjoyment and public gatherings. This includes public parks, gardens, reserves, waterways, publicly owned forecourts and squares.”
Open Space is defined into 3 areas:
Regional Open Space (above 5 hectares) – are valued and visited by a broader catchment of people as well as the local community. e.g. Sydney Park
District Open Space (between 2 – 5 hectares) – are valued and visited primarily by people with the corridor providing facilities that include organised and unstructured sport and recreation activities. e.g. Victoria Park
Local Open Space (between 0.5 – 2 hectares) – provides a diversity of character and facilities that appeal to the local community at a neighbourhood level. A 400 metre walkable distance is used for Local Open Space. (8) e.g. Hollis Park
According to the Recreation and Open Space Planning Guidelines for Local Government (Department of Planning, 2010), the locally appropriate provision standard for recreational open space in Inner Urban areas within Metropolitan Sydney should be around 15 percent of an LGA’s (Local Government Area) share of non-industrial land (9% for Local/District Open Space and 6% for Regional Open Space) to ensure that there is a 1.5-hectare park within 1 kilometre of most dwellings and a 1000-square metre ‘pocket park’ within 400 metres of most dwellings to provide for neighbourhood needs.
This is great as it works for the current existing community but we are injecting 1600+ new residents into the area (more when North Eveleigh North (other side of carriage works) comes online. These percentage based Open Space measurements don’t take into account population DENSITY.
Urban Growth NSW have two new Pages on their Website about Density. They don’t really say anything specific but its nice that they are there…
Site Comparisons
| Site | Gross Area | Hectares per 1000 People | Population Density | Open Space | % Open Space | Population | OS m² per person | |
| Central Park Broadway | 5.8 ha | .28 ha per 1,000 population | 431 people per hectare | 0.8 ha | 12% | 2500 | 3.2m² | |
| Victoria Park Zetland | 24.4 ha | 1.22 ha per 1,000 population | 125 people per hectare | 3.7 ha | 15% | 3060 | 12.0m² | |
| Harold Park | 10.6 ha ? | 1.9 ha per 1,000 population ? | 235 people per hectare ? | 3.8 ha? | 33 % ? | 2500? | 20 m² ? | |
| Green Square | 13.7 ha | 0.20 ha per 1,000 population | 490 people per hectare | 1.4 ha | 10% | 6750 | 2.0m² | |
| Rhodes West | 46 ha | 1.28 ha per 1,000 population | 123 people per hectare | 7.3 ha | 16% | 5680 | 12.8m² | |
| North Eveleigh West | 3.09 ha | .20 ha per 1,000 population | 506 people per hectare | 0.35 ha | 11% | 1600 | 2.1m² |
The above shows an alarming trend in High Density – Low Area Developments that are Packing people into smaller areas and offering less Open Space. As an example South Australia legislates 12.5% of land is to be used for open space which relates to around 4ha per 1000 people in a lower Density development area of 35 ha. It does not make sense that this “percentage ratio” can be used in Higher Density developments. Some studies suggest that an increase in open space is required to compensate the increase in density with people having less private open space. (4)
(Harold Park DCP specified a minimum of 25% to be used for public open space – excluding Private open space)
(Green Square DCP also specified a minimum of 25% of land to be used for public open space – excluding Private open space, although the above seems to contradict that)
(North Eveleigh 2008 Guidelines response to the Director Generals Report that recommended 25%-30% of land to be used for public open space(page 5).
Some Background to Open Space Measurements
The relatively old metric used by NSW residential urban planners is to allow for 2.83 hectares of Open Space per 1000 residents within a development (1). The Density based benchmark benchmark takes into consideration that people in higher density dwellings need greater access and quality open space and public realm – their backyard is the public domain.
The standard of 2.83 hectares (7 acres) hectares of open space per 1000 population, which has been widely used in New South Wales and elsewhere in Australia, dates back at least to the 1940s. 1975 and 1985 survey reports noted the widespread practice in NSW of dividing the 2.83 ha into 1.21 ha for ‘active’ open space and 1.6 ha into ‘passive’ open space. Even current NSW Open Space Audits reference this metric (7).
This benchmark, a globally adopted maxim originally conceived in the UK, has in recent years been described as outdated and unrealistic in the planning of our new high density city centres. In practice, provision has varied considerably from the traditional formula of 2.83 hectares per 1000 people – from a Inner Sydney median of 1.6 ha to 6.32 ha for some outer council areas (dominated by sports grounds). The use of such a numerical standard to determine adequate levels of open space is said by some to be no longer generally accepted as a satisfactory method of Planning for open space (developers), yet it remains a well used reference guide and Yardstick for the adequate provision of open space (5)(6). As the alternative ‘needs based’ measures and metrics are somewhat ‘holistic’ and at best sketchy in terms of actual metrics we still see current references to the original method as they are quantifiable (2)(3).
The Sydney Section 94 Developer Contributions plan makes estimates 5.5m² being available per resident by 2020 (p83).
http://sydneyyoursay.com.au/city-of-sydney-development-contributions-plan-updates/documents
Proposed updates to the Plan in early 2016 (Currently under review) are looking to reduce this figure to 2.1m² for each resident. Until updates to the DCP are ratified the plans must reflect the current documents.
Addressing Population Growth and Density
In the report on population growth projections UGNSW have used their own statistical calculations to measure population growth which are overall much higher than the Department of Planning & Environment (DPE) 2011 report. We can see from table 15 that compared to the “2036 DPE estimation” of around 1100 residents for the North Eveleigh West precinct Urban Growth NSW has been using the “2036 UGNSW High Scenario” of 1600 residents. The reasoning used was UG thought the 2011 census data was incorrect and instead of using a population of 51 700 in the study area they have increased the starting population to 59000.(page 22). NOTE – This conflicts with table 4 on page 33 which suggests 56700 population. Why is this? Its not really clear but one reason is that they probably have to find a way to pay for Central to Eveleigh and the more properties they can build the more economically Viable the development appears.
Table 13 below shows the overall potential population growth for the Study Area from 2011 to 2036 based on the predicted growth by the Department of Planning and Environment (DPE), and based on the low, medium and high development scenarios for the Central to Eveleigh project. (page 68)
 NOTE 1 – “The City of Sydney is updating the Open Space & Recreation Needs Strategy 2006 and reviewing its Section 94 Contributions Plan 2006. The Council recently resolved that the Open Space, Sports and Recreation Needs Study will be prepared by the end of 2015” (page 81)
NOTE 2 – As of April 12 2016 the UGNSW website still states “potential new residents” as bw 29,000 and 56,000. So although Urban Growth are telling us they are not furthering discussions on building heights the below seems to suggest there is flexibility in density depending on the outcome of the overall proposition.
NOTE 3 – This article on News.com.au predicts by 2030 54,000 people will call Green Square home.
The DPE report also claims that the rise in single-person and couple-only households, as well as an ageing population, is driving the need for smaller dwellings. It also showed how the government would create housing diversity, which included studio or “granny flats”, smaller block sizes in suburbia, an increased number of townhouses and terraces and manor homes (four separately titled units within the same building). This is not the case with the Urban Growth Central to Eveleigh plan. “Let’s not just build tower blocks at extortionate prices, let’s build dwellings that Australians are happy to come home to.”
How do we get an acceptable result of Density and Open Space built to maintain a Vibrant Community?
The aim is to build communities where people want to live, not just build lots of 1 and 2 bedroom High Density rental stock. UG appears to be providing a market with specific customers in mind – ones without children.
The most sensible result would be to reduce the population density to a figure that is more appropriate to what the space can provide. The original plan of 8-12 Storeys which would manage a proposed population of around 800 residents was better. The 2016 plan increased the density by 20% to provide 600- 700 apartments (equating to an additional 1400 residents on top of the 200 in the Platform Apartments). The 20% increase was based on “population growth and site specific design opportunities“. (page42 UGNSW – North Eveleigh – Plan for a new neighbourhood 2015).
Reversing that would leave us with 1120 residents immediately making more open space.
Additionally the NSW Government could follow through with changes to legislation making it harder for property owners to to leave the 10,000 CBD premises vacant.
It is quite obvious that UGNSW is reluctant to change the Density and building heights in North Eveleigh as it creates a precedent for the forthcoming developments in the Central to Eveleigh tract. In followup Posts we will put the facts together to present to the minister for planning (and the shadow minister) as Urban Growth have made it quite clear they are not moving on this.
The Report from Charles Sturt University offers some fantastic references to many recent case studies on open space consideration in High Density residential areas (4). The benefits of Open Space is obviously necessary to urban planning and is backed up by the 100’s of Australian and International Reports on the subject. The benefits are generally outlined in Social, Economic and Environmental impacts.
REFERENCES
(1) Density Health Workshop Report NSW
(2) https://thebayssydney.com.au/wp-content/uploads/2015/10/BaysPrecinctStrategicFrameworkReportVol1.pdf?2274ba&2274ba
(3) Sydney Open Space Report 2016
http://www.planning.nsw.gov.au/en/Plans-for-Your-Area/Sydney/Sydney-Districts/~/media/7621E08C4AE24C9FBC4970D3438A4C9A.ashx
(4) Best Practice Open Space in Higher Density Developments (2011)
https://www.charlessturt.sa.gov.au/webdata/resources/files/Best%20Practice%20Open%20Space%20in%20Higher%20Denisty%20Developments%20-%20Report%201%20Research%20Findings%20-%2022%20June%202012%20-%20FINAL.pdf
(5) PP01_WP11_Open Space Standards_2009_E3.pdf
(6) http://www.planning.nsw.gov.au/~/media/Files/DPE/Plans-and-policies/appendix-j-open-space-and-community-facilities-assessment-kellyville-station-precinct-2015-12.ashx
“The current default in many parts of NSW is a rate of 2.8ha per 1,000 new residents. This rate features in a number of planning frameworks, including the NSW Government’s Growth Centres Code and local government open space strategies and development contributions plans3. As an alternative, the Guidelines suggest a default rate of 15% of non-industrial land be allocated for open space purposes.”
(7) http://www.planning.nsw.gov.au/~/media/Files/DPE/Reports/central-district-open-space-definitions-sydney-open-spaces-draft-audit-summary-2016-02-29.ashx
(8) http://www.planning.nsw.gov.au/~/media/Files/DPE/Strategy-documents/draft-sydenham-to-bankstown-corridor-strategy-open-space-and-recreation-strategy-2015-05-25.ashx
(9) http://www.planning.nsw.gov.au/~/media/Files/DPE/Strategy-documents/draft-sydenham-to-bankstown-corridor-strategy-open-space-and-recreation-strategy-2015-05-25.ashx
(10) https://www.sa.gov.au/__data/assets/pdf_file/0016/17530/Best_Practice_Open_Space_in_Higher_Density_Developments_Project_Summary_Report_June_2012.pdf
(11)http://www.ugdc.nsw.gov.au/sites/default/files/file_root/PDFs/Precincts/Redfern_Waterloo/North_eveleigh_concept_plan/Electronic_copy_DOP/Appendix%206%20Residential%20Flat%20Code.pdf


